violin-plot-r
ShowCase
Online example will be available soon.

Description
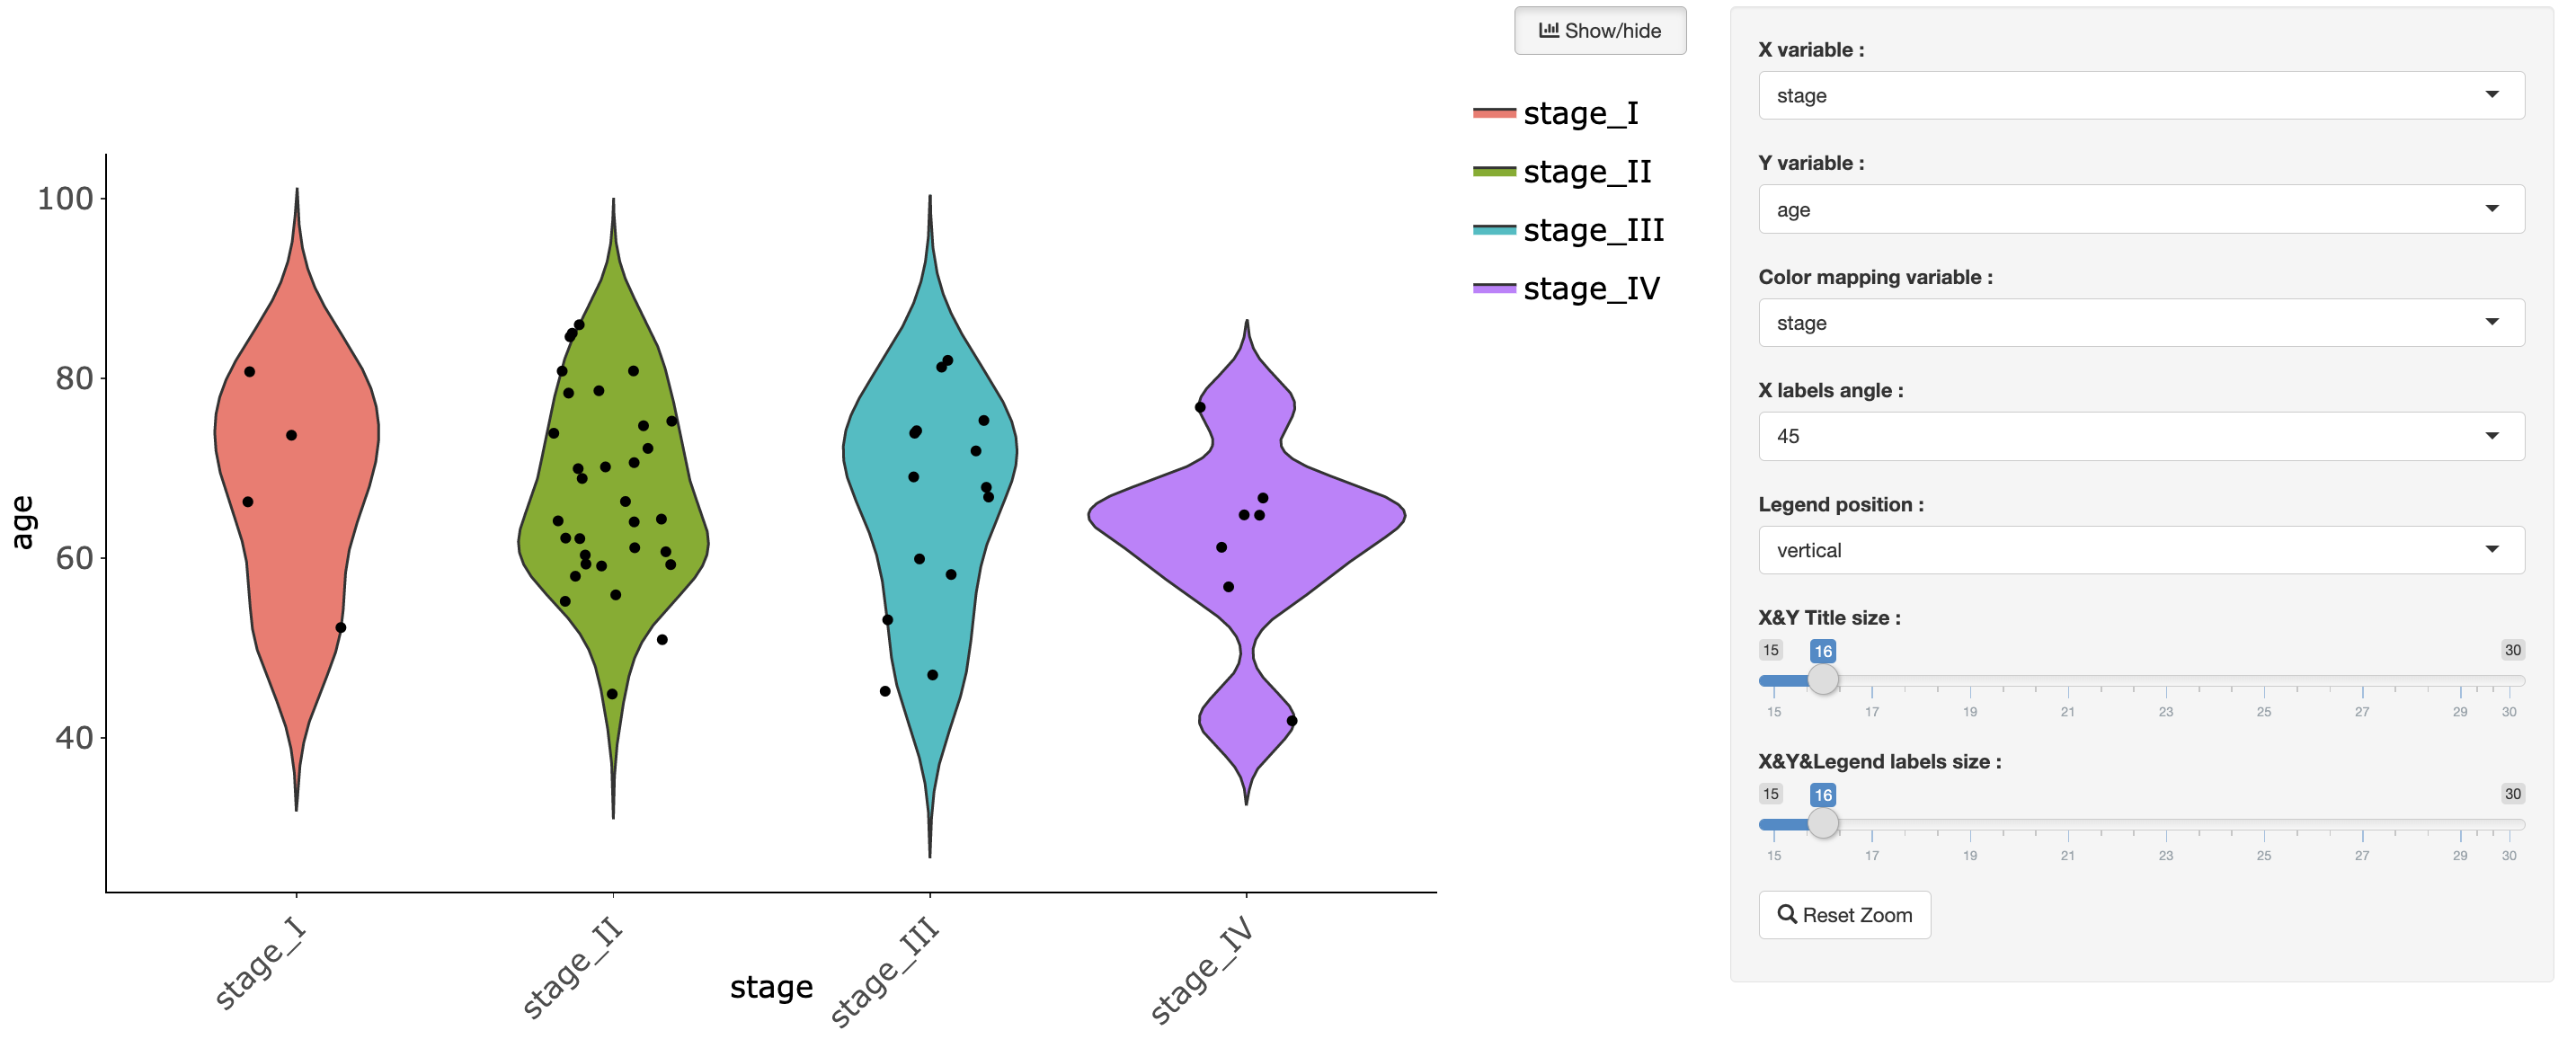
Interactive violin plot visualization from a Shiny app(r version).
Example Data
    TP53     KRAS     EGFR OS_Status OS_Time age     stage
4.827859 3.217293 3.035919         0    2973  66   stage_I
3.611481 2.940355 3.114689         0    3674  57  stage_IV
4.012998 2.947884 3.449437         1    1147  64  stage_II
3.282482 2.723632 3.568452         1    1357  42  stage_IV
5.054779 2.640598 2.404610         0    1324  65  stage_IV
3.443296 3.516531 3.841558         0    1351  74  stage_II
3.839475 2.759294 3.391223         0    1159  69  stage_II
3.722616 3.335489 3.691214         0    1280  65  stage_IV
4.410951 3.085761 3.154411         0    1301  55  stage_II
2.429508 3.847008 4.858569         1     761  51  stage_II
4.585097 2.788753 3.284768         0    1130  74 stage_III
3.791531 3.455349 2.447410         0    1163  77  stage_IV
Usage
@violin-plot-r(dataFile='violin_plot.rds', dataType='rds', title='',
               xAxis='stage', xTitle='stage', yAxis='age', yTitle='age',
               xAngle=45, colorAttr='stage', subtitle='', text='')
Arguments
; Configuration for violin_plot.
[data]
; input data, may be a file or other data source.
; input data must be tidy data.
dataFile = violin_plot.rds
; data file format
dataType = rds

[attributes]
; Shiny app title
title =
; The column name from data frame for x axis attribute
xAxis = stage
xTitle = stage
xAngle = 45
; The column name from data frame for y axis attribute
yAxis = age
yTitle = age
; The column name from data frame for color attribute
colorAttr = stage
; query url
queryURL = https://www.duckduckgo.com/?q=
; subtitle and text for violin plot
subtitle =
text =
Value
An interactive violin plot.
Author(s)
Jingcheng Yang(yjcyxky@163.com)
Examples
# If you need to show a default interactive plot by using sample data
@violin-plot-r()

# If you have a custom data, you need to reset these arguments at least.
@violin-plot-r(dataFile='violin_plot.rds', dataType='rds',
               xAxis='stage', yAxis='age')
Last update:
2022-06-04