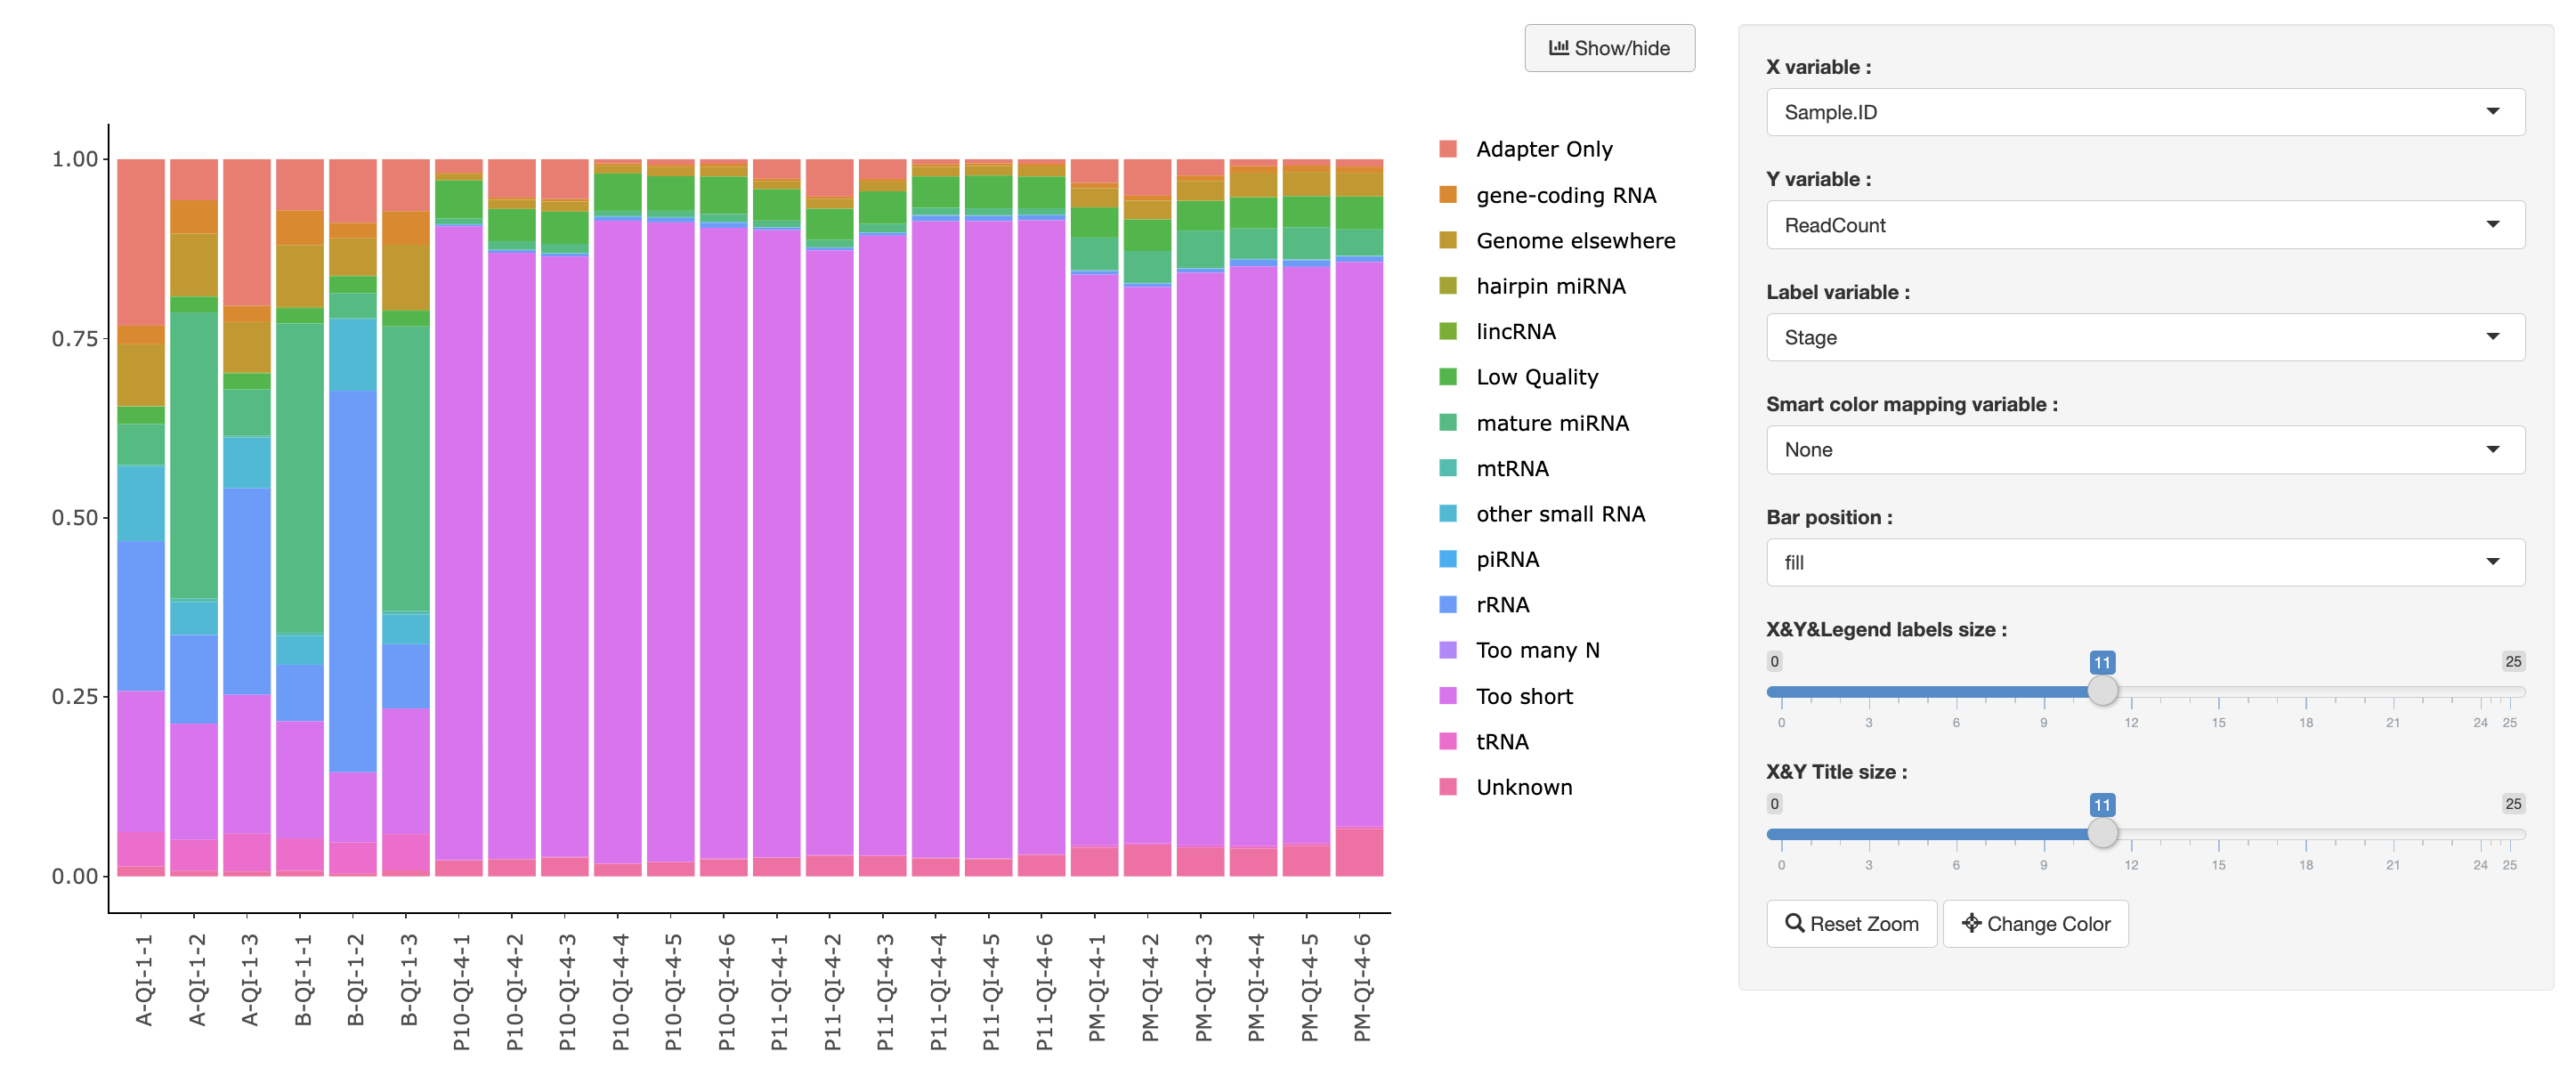
stack-barplot-r
ShowCase
Click the image to view the online example.
Description
Interactive stack barplot visualization from a Shiny app(r version).
Example Data
        Stage ReadCount  Sample.ID StageGroup
Adapter Only   2178202   A-QI-1-1          1
Adapter Only    706077   A-QI-1-2          1
Adapter Only   1674179   A-QI-1-3          1
Adapter Only    991912   B-QI-1-1          1
Adapter Only    889332   B-QI-1-2          1
Adapter Only    677786   B-QI-1-3          1
Adapter Only    286820 P10-QI-4-1          1
Adapter Only    805699 P10-QI-4-2          1
Adapter Only    766579 P10-QI-4-3          1
Adapter Only    104417 P10-QI-4-4          1
Adapter Only    113903 P10-QI-4-5          1
Usage
@stack-barplot-r(dataFile='stack-barplot-example.rds', dataType='rds', title='',
                 xAxis='Sample.ID', xTitle='Sample.ID', yAxis='ReadCount', yTitle='ReadCount',
                 xAngle=90, labelAttr='Stage', subtitle='', text='', barPos='fill',
                 smartColor='StageGroup')
Arguments
; Configuration for stack barplot
[data]
; input data, may be a file or other data source.
; input data must be tidy data.
dataFile = stack-barplot-example.rds
; data file format
dataType = rds

[attributes]
; Shiny app title
title =
; The column name from data frame for x axis attribute
xAxis = Sample.ID
xTitle =
xAngle = 90
; The column name from data frame for y axis attribute
yAxis = ReadCount
yTitle =
labelAttr = Stage
; query url
queryURL = https://www.duckduckgo.com/?q=
; subtitle and text for scatter chart
subtitle =
text =
; Bar position, choices: fill, dodge, stack
barPos = fill
; The column name from data frame for smart color attribute
smartColor = StageGroup
Value
An interactive stack barplot.
Author(s)
Jingcheng Yang(yjcyxky@163.com)
Examples
# If you need to show a default interactive plot by using sample data
@stack-barplot-r()

# If you have a custom data, you need to reset these arguments at least.
@stack-barplot-r(dataFile='stack-barplot-example.rds', dataType='rds',
                 xAxis='Sample.ID', yAxis='ReadCount')
Last update:
2022-06-04
