scatter-plot-r
ShowCase
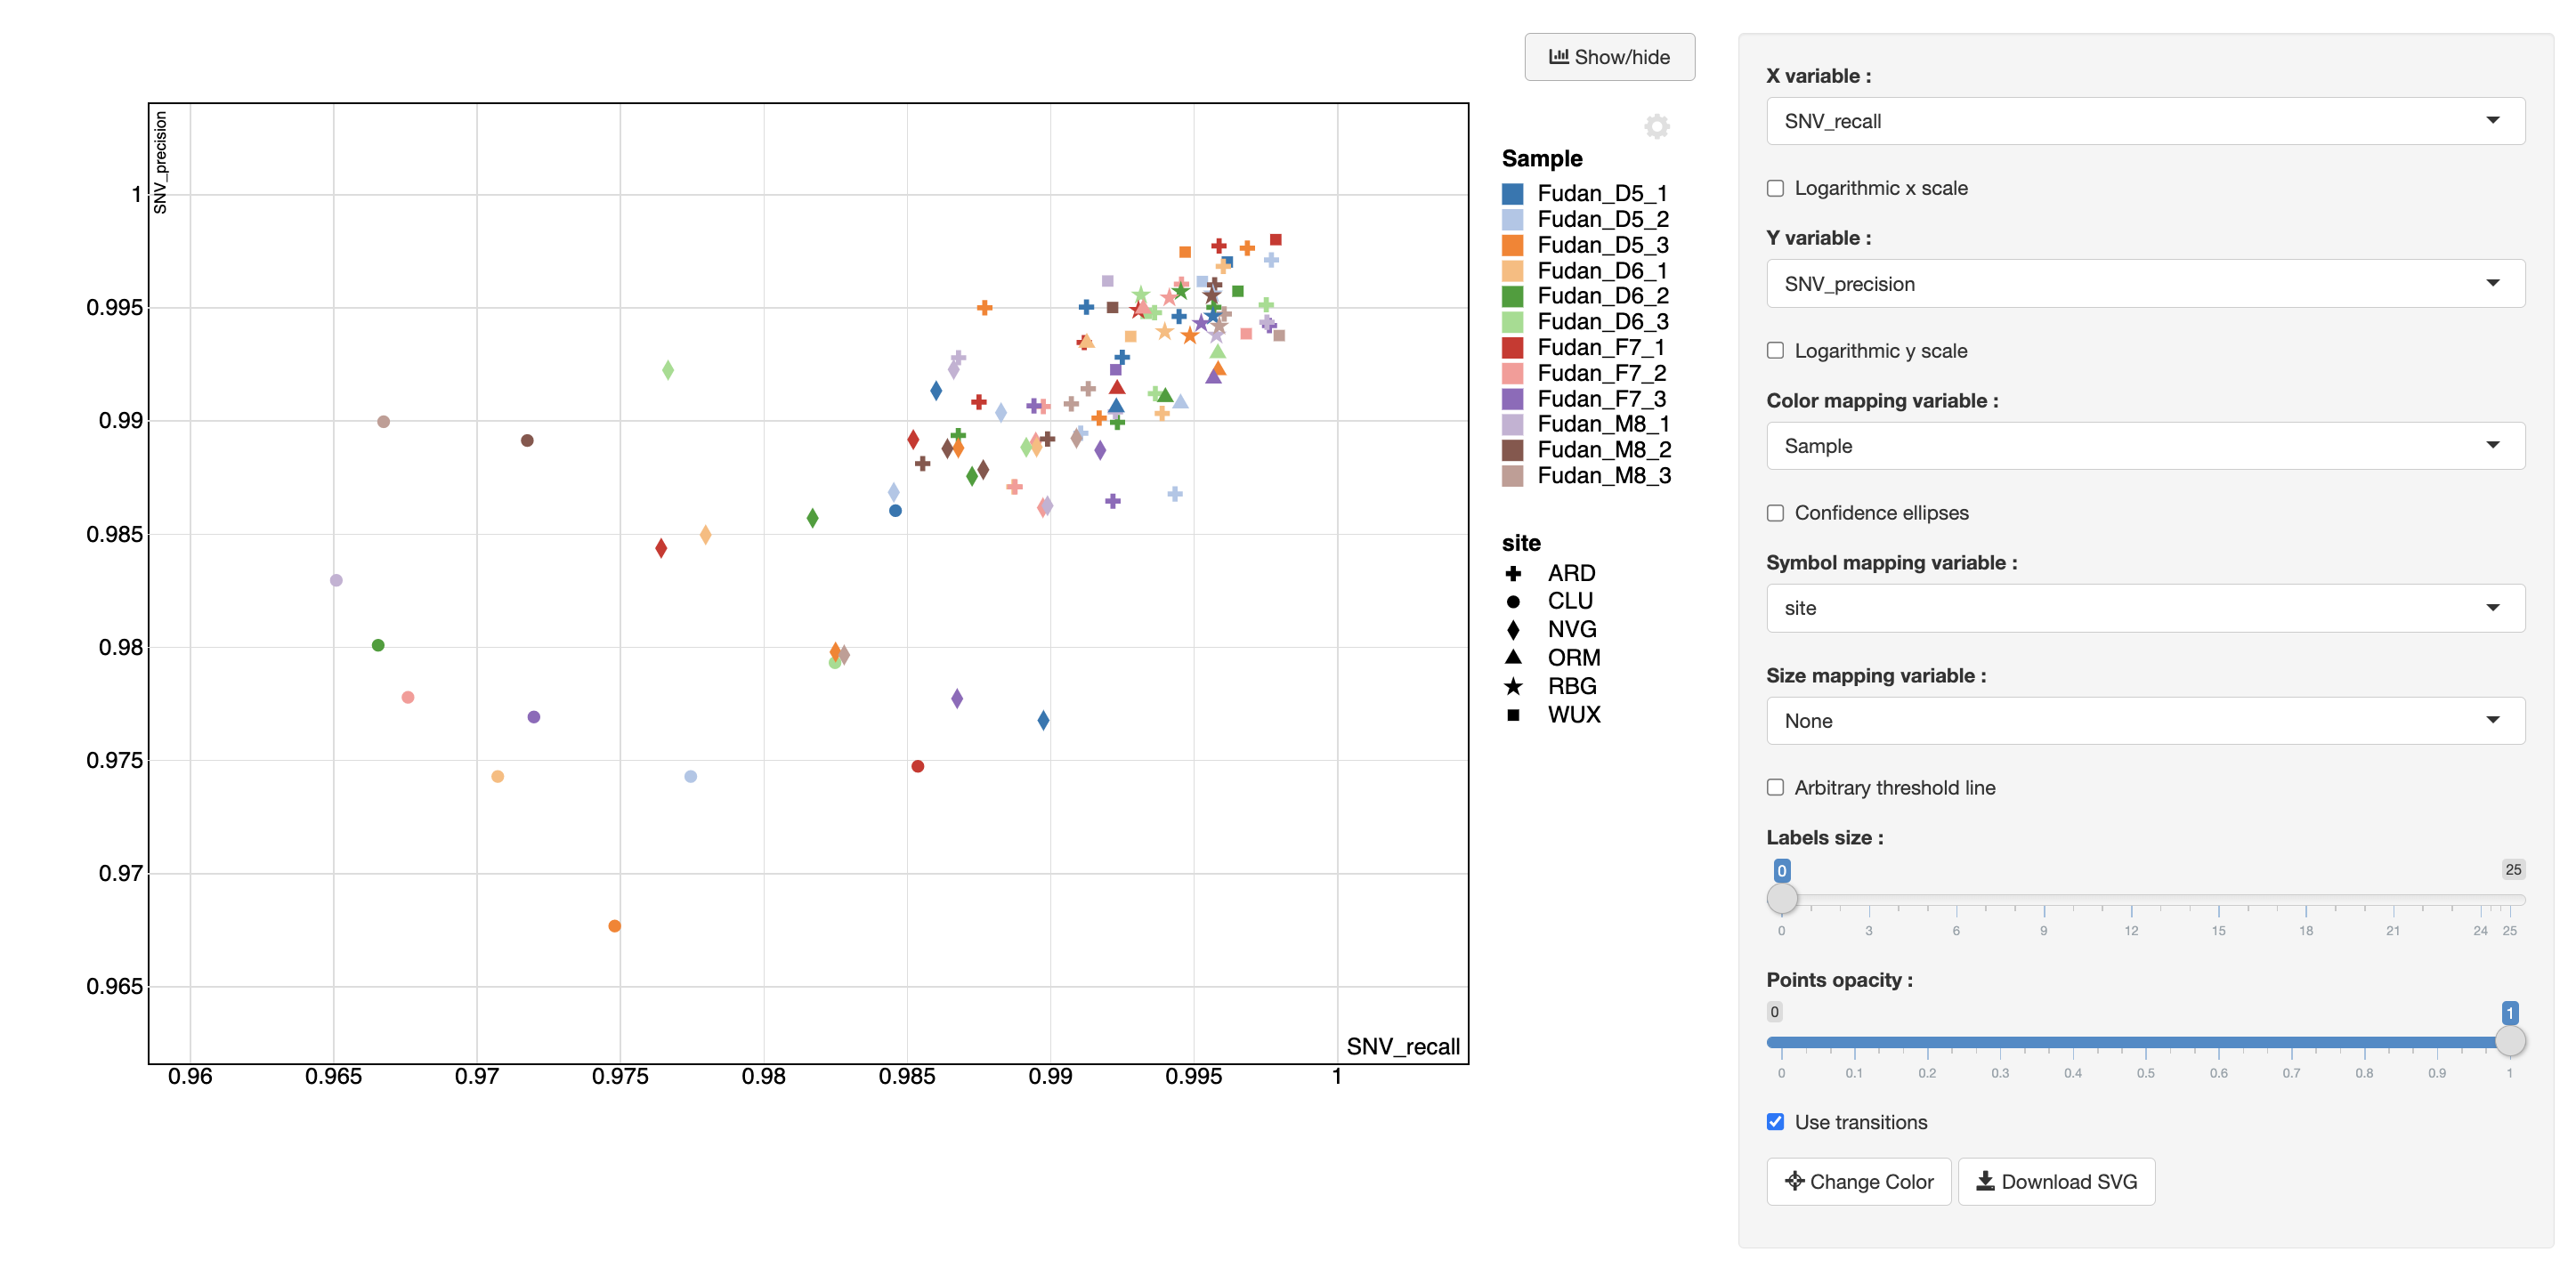
Click the image to view the online example.
Usage
@scatter-plot-r(dataFile='performance_demo.rds', dataType='rds', title='',
                xAxis='SNV_recall', yAxis='SNV_precision', sizeAttr='Time',
                colorAttr='variable', labelAttr='labels', nameAttr='site',
                subtitle='', text='')
Arguments
; Configuration for Scatter Chart
[data]
; input data, may be a file or other data source.
; input data must be tidy data.
dataFile = performance_demo.rds
; data file format
dataType = rds

[attributes]
; Shiny app title
title =
; The column name from data frame for x axis attribute
xAxis = SNV_recall
; The column name from data frame for y axis attribute
yAxis = SNV_precision
; ; The column name from data frame for size attribute
sizeAttr = Time
; ; The column name from data frame for scatter name
nameAttr = site
; ; The column name from data frame for color attribute
colorAttr = Sample
; ; The column name from data frame for point label
labelAttr = sample_name
; query url
queryURL = https://www.duckduckgo.com/?q=
; subtitle and text for scatter chart
subtitle = A preformance demo from the Chinese Quartet
text =
; X & Y axis and legend font size
fontSize = 16
showpanel = True
Last update:
2022-06-04