rocket-plot-r
ShowCase
Online example will be available soon.
Description
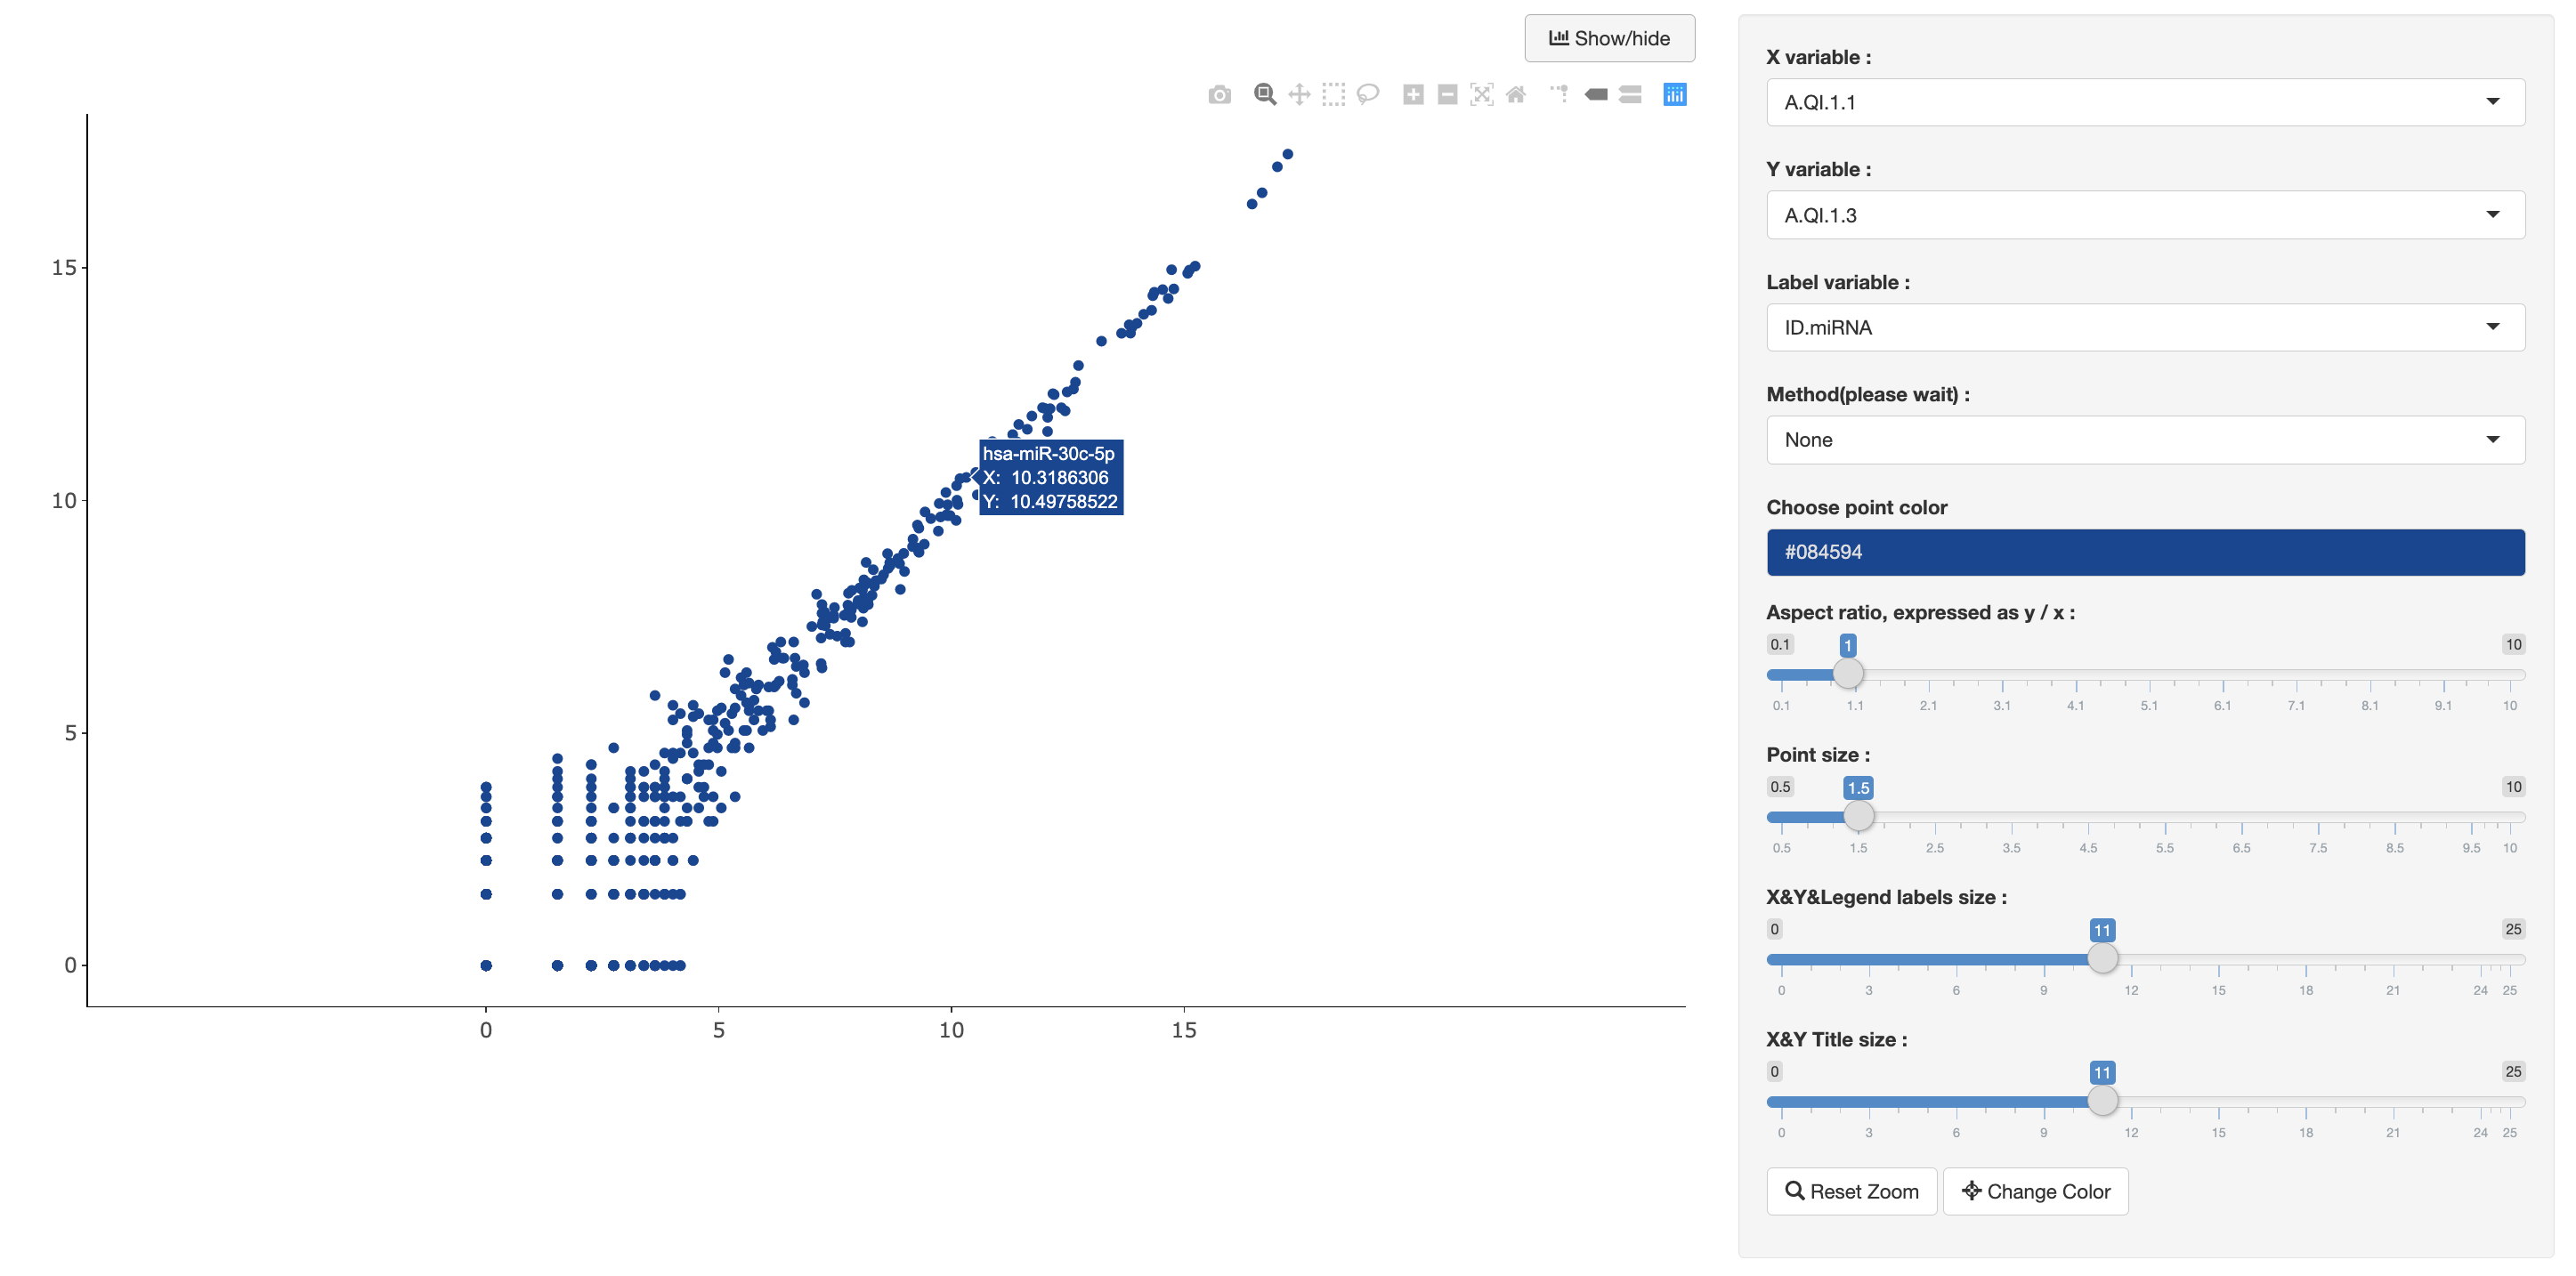
Interactive rocket plot visualization from a Shiny app(r version).
Example Data
    ID.miRNA  A.QI.1.1   A.QI.1.2  A.QI.1.3   B.QI.1.1  B.QI.1.2   B.QI.1.3
hsa-let-7a-5p 17.229546 17.5298890 17.450287 17.6053028 17.418615 17.4270934
hsa-let-7b-5p 17.003783 17.2648570 17.177195 17.3531438 17.135108 17.2305650
hsa-let-7c-5p 14.730315 15.8122775 14.963884 15.9381663 14.891995 15.8957725
hsa-let-7d-5p 12.729670 12.7560022 12.903733 12.7636084 12.860683 12.7553675
hsa-let-7e-5p 14.358456 14.2749982 14.480325 14.3446585 14.573276 14.1889370
hsa-let-7f-5p 14.130429 15.8313783 14.005740 15.7909300 14.097287 15.6946755
hsa-let-7g-5p 13.224542 13.8243976 13.427797 13.8694199 13.304371 13.9239037
hsa-let-7i-5p 16.675953 15.0214654 16.619071 15.0821202 16.534948 15.1626320
Usage
@rocket-plot-r(dataFile='rocket_plot.rds', dataType='rds', title='',
               xAxis='A.QI.1.1', xTitle='A.QI.1.1', yAxis='A.QI.1.3', yTitle='A.QI.1.3',
               xAngle=0, labelAttr='ID.miRNA', method='None', pointAlpha=1,
               pointSize=1, subtitle='', text='')
Arguments
; Configuration for rocket plot
[data]
; input data, may be a file or other data source.
; input data must be tidy data.
dataFile = rocket_plot.rds
; data file format
dataType = rds

[attributes]
; Shiny app title
title =
; The column name from data frame for x axis attribute
xAxis = A.QI.1.1
xTitle =
xAngle = 0
; The column name from data frame for y axis attribute
yAxis = A.QI.1.3
yTitle =
labelAttr = ID.miRNA
; query url
queryURL = https://www.duckduckgo.com/?q=
; support None, linear_regression, pearson_correlation
method = None
; subtitle and text for scatter chart
subtitle =
text =
pointAlpha = 1
pointSize = 1.5
Value
An interactive rocket plot.
Author(s)
Jingcheng Yang(yjcyxky@163.com)
Examples
# If you need to show a default interactive plot by using sample data
@rocket-plot-r()

# If you have a custom data, you need to reset these arguments at least.
@rocket-plot-r(dataFile='rocket_plot.rds', dataType='rds', xAxis='A.QI.1.1', yAxis='A.QI.1.3')
Last update:
2022-06-04