lineplot-r
ShowCase
Online example will be available soon.
Description
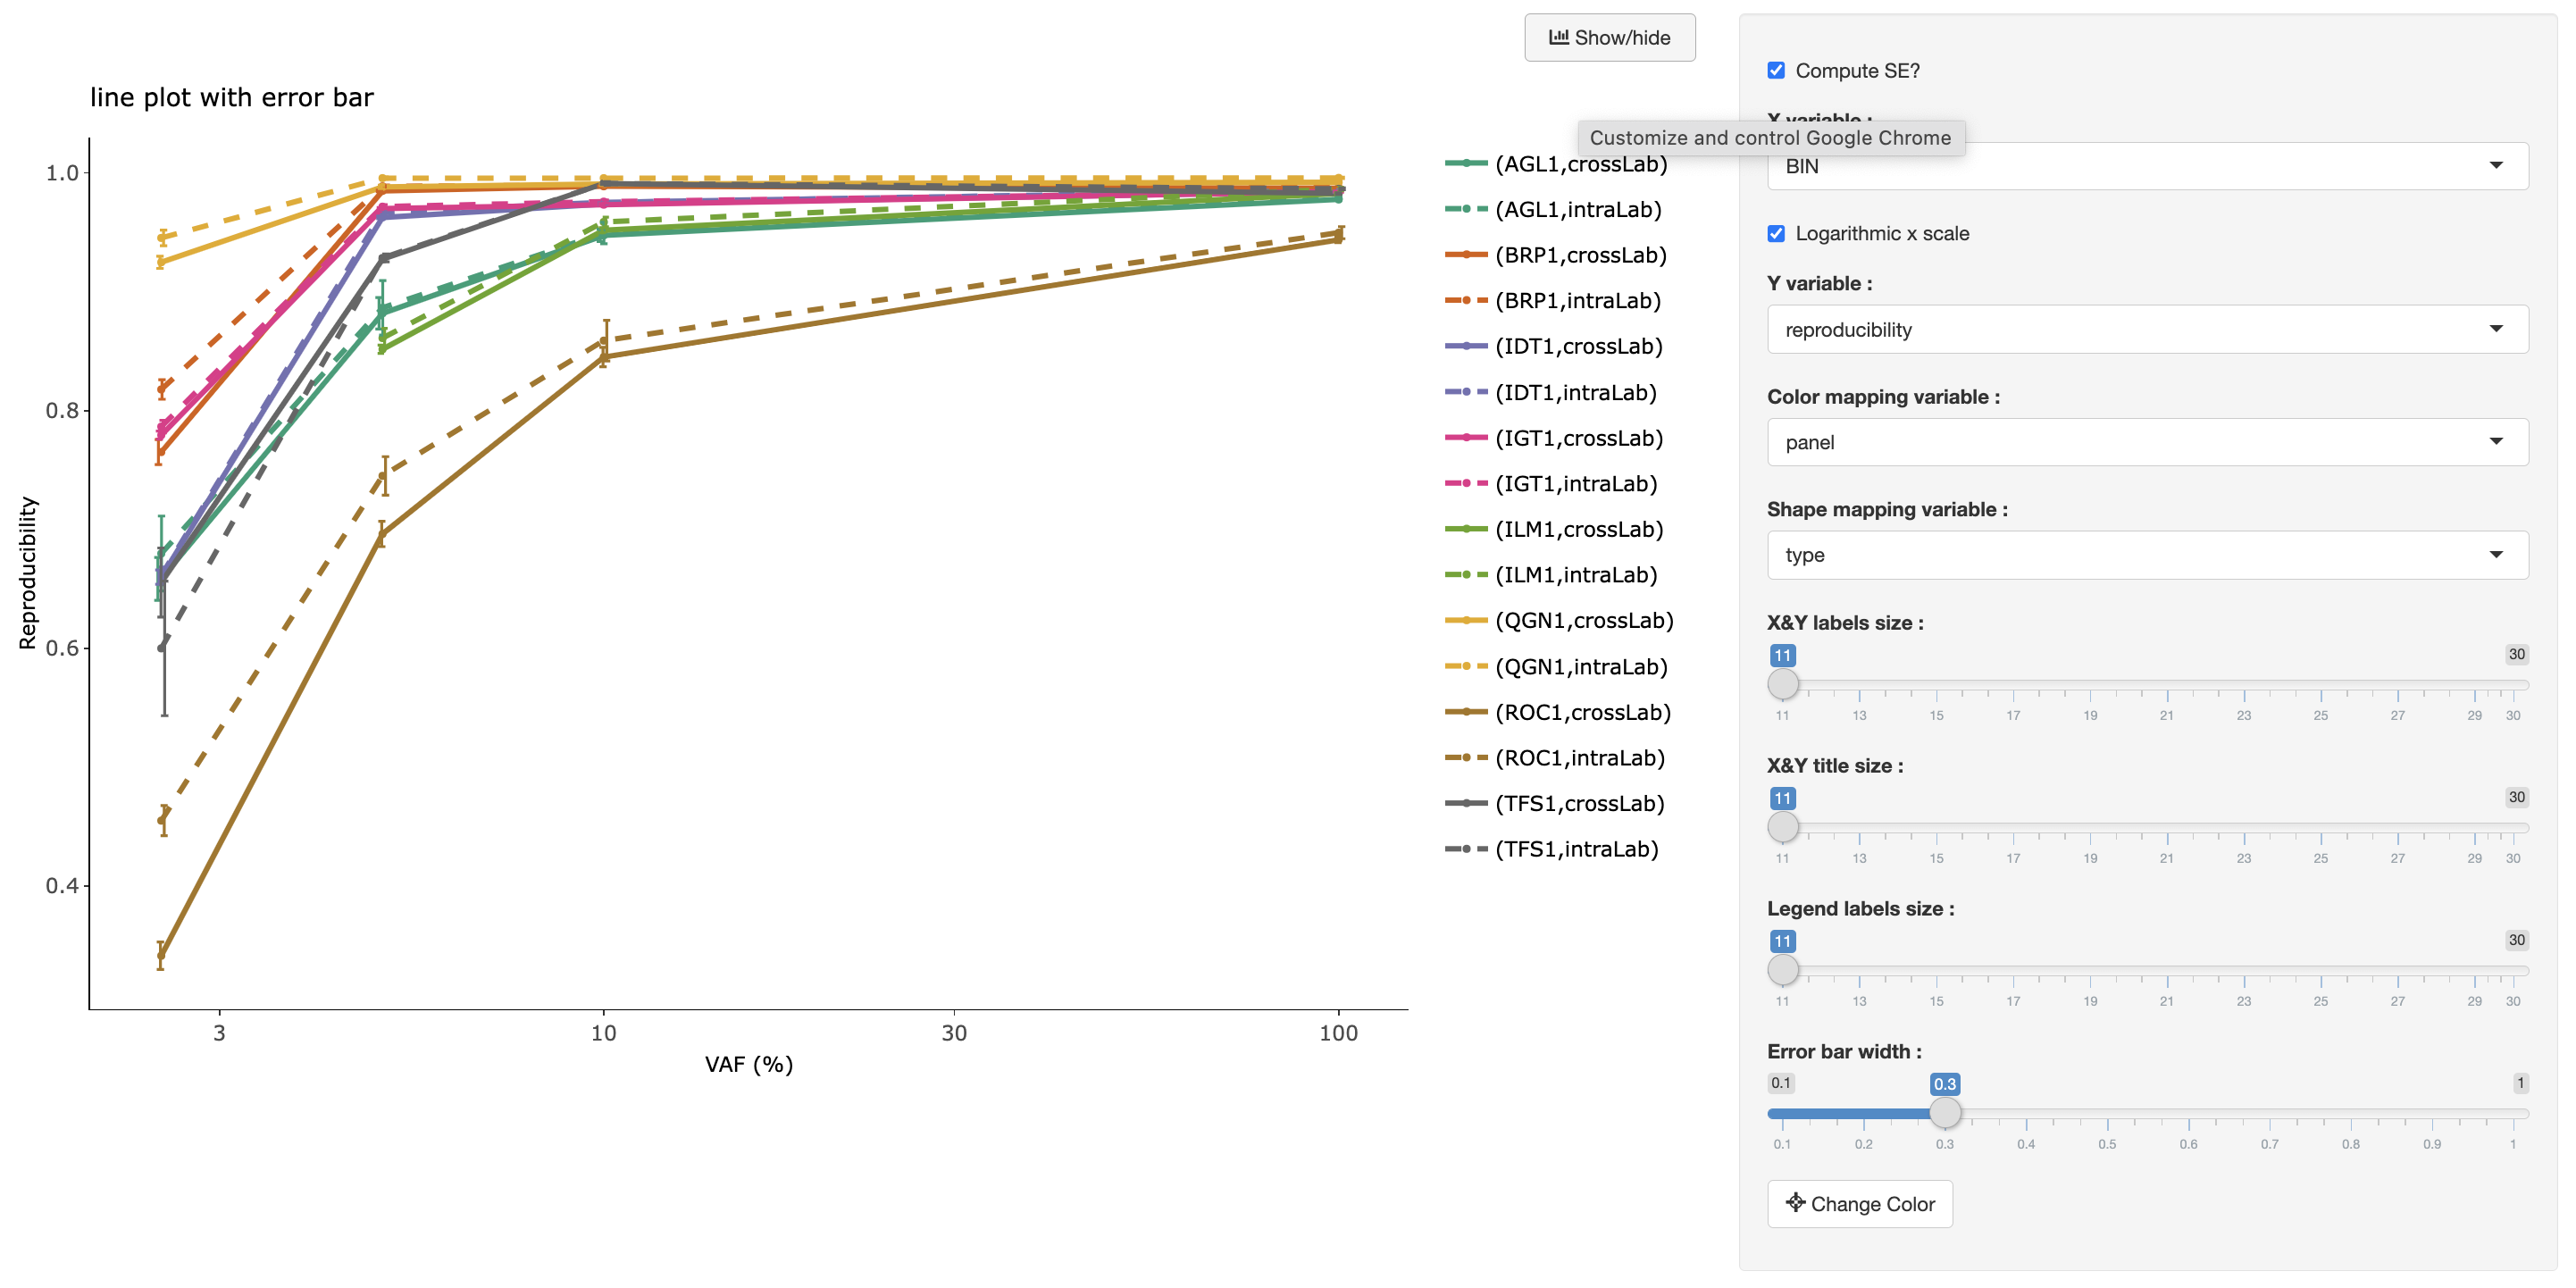
Interactive line plot visualization from a Shiny app(r version).
Example Data
panel           VS        BIN     type reproducibility
AGL1 ST01[1]_vs_ST02[1]   2.5 crossLab       0.8225977
AGL1 ST02[1]_vs_ST01[1]   2.5 crossLab       0.8379800
AGL1 ST01[1]_vs_ST02[1]   5.0 crossLab       0.9678284
AGL1 ST02[1]_vs_ST01[1]   5.0 crossLab       0.9705620
AGL1 ST01[1]_vs_ST02[1]  10.0 crossLab       0.9691673
AGL1 ST02[1]_vs_ST01[1]  10.0 crossLab       0.9762078
AGL1 ST01[1]_vs_ST02[1] 100.0 crossLab       0.9811579
AGL1 ST02[1]_vs_ST01[1] 100.0 crossLab       0.9813103
AGL1 ST01[1]_vs_ST02[2]   2.5 crossLab       0.8178458
AGL1 ST02[2]_vs_ST01[1]   2.5 crossLab       0.8197314
Usage
@lineplot-r(dataFile='linebarwitherr_data.rds', dataType='rds', title='',
            xAxis='BIN', xTitle='VAF (%)', yAxis='reproducibility', yTitle='Reproducibility',
            colorAttr='panel', shapeAttr='type', xLog10=True, enableSE=True,
            showpanel=True, subtitle='', text='', queryURL='')
Arguments
; Configuration for Scatter Chart
[data]
; input data, may be a file or other data source.
; input data must be tidy data.
dataFile = linebarwitherr_data.rds
; data file format
dataType = rds

[attributes]
; Shiny app title
title = line plot with error bar
; column name
xAxis = BIN
xTitle = VAF (%)
yAxis = reproducibility
yTitle = Reproducibility
colorAttr = panel
shapeAttr = type
xLog10 = True
enableSE = True
xyLabelsize = 11
xyTitleSize = 11
legendLabelsize = 11
errorBarWidth = 0.3
; query url
queryURL = https://www.duckduckgo.com/?q=
; subtitle and text for scatter chart
subtitle =
text =
showpanel = True
Value
An interactive line plot with error bar.
Author(s)
Jingcheng Yang(yjcyxky@163.com)
Examples
# If you need to show a default interactive plot by using sample data
@lineplot-r()

# If you have a custom data, you need to reset these arguments at least.
@lineplot-r(dataFile='linebarwitherr_data.rds', dataType='rds', xAxis='BIN', yAxis='reproducibility')
Last update:
2022-06-04