heatmap-d3-r
ShowCase
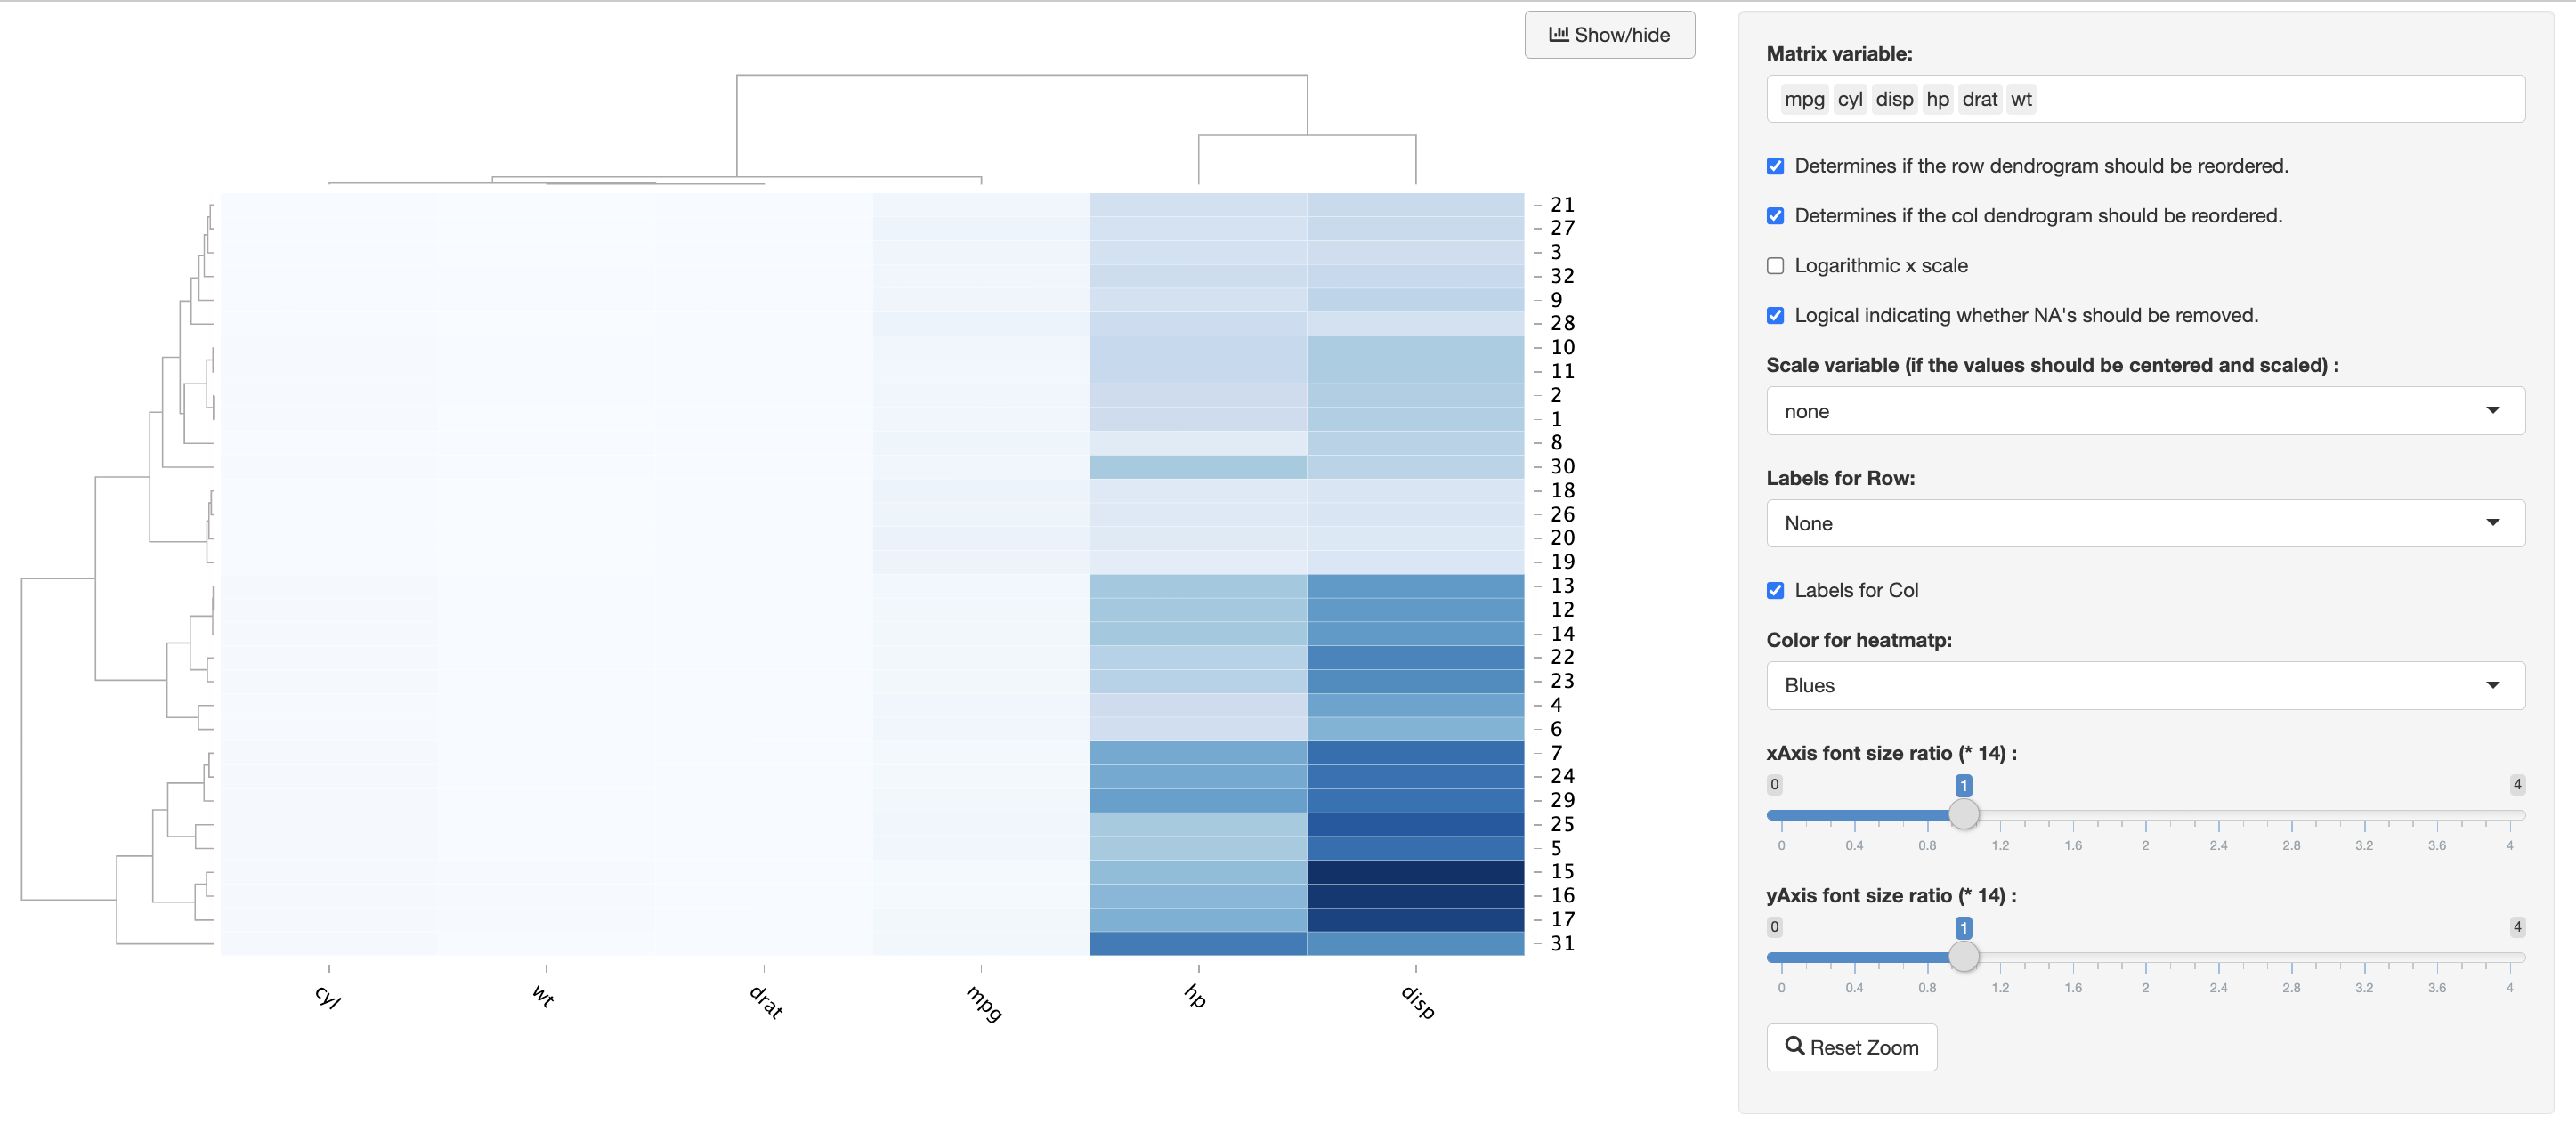
Click the image to view the online example.
Arguments
; Configuration for Scatter Chart
[data]
; input data, may be a file or other data source.
; input data must be tidy data.
dataFile = mtcars.rds
; data file format
dataType = rds

[attributes]
; Shiny app title
title =
; determines if and how the row dendrogram should be reordered. By default, it is TRUE, which implies dendrogram is computed and reordered based on row means. If NULL or FALSE, then no dendrogram is computed and no reordering is done. If a dendrogram, then it is used "as-is", ie without any reordering. If a vector of integers, then dendrogram is computed and reordered based on the order of the vector.
rowv = TRUE
; determines if and how the column dendrogram should be reordered. Has the options as the Rowv argument above and additionally when x is a square matrix, Colv = "Rowv" means that columns should be treated identically to the rows.
colv = TRUE
; function used to compute the distance (dissimilarity) between both rows and columns. Defaults to dist.
distfun = dist
; function used to compute the hierarchical clustering when Rowv or Colv are not dendrograms. Defaults to hclust.
hclustfun = hclust
; character indicating if the values should be centered and scaled in either the row direction or the column direction, or none. The default is "none".
scale = none
; character vectors with row labels to use (from top to bottom); default to rownames(x).
labRow = None
labCol = False
; colnames for heatmap matrix, str split by ,
colNameLst = None
; query url
queryURL = https://www.duckduckgo.com/?q=
; subtitle and text for scatter chart
subtitle =
text =
showpanel = True
Examples
Last update:
2022-06-04