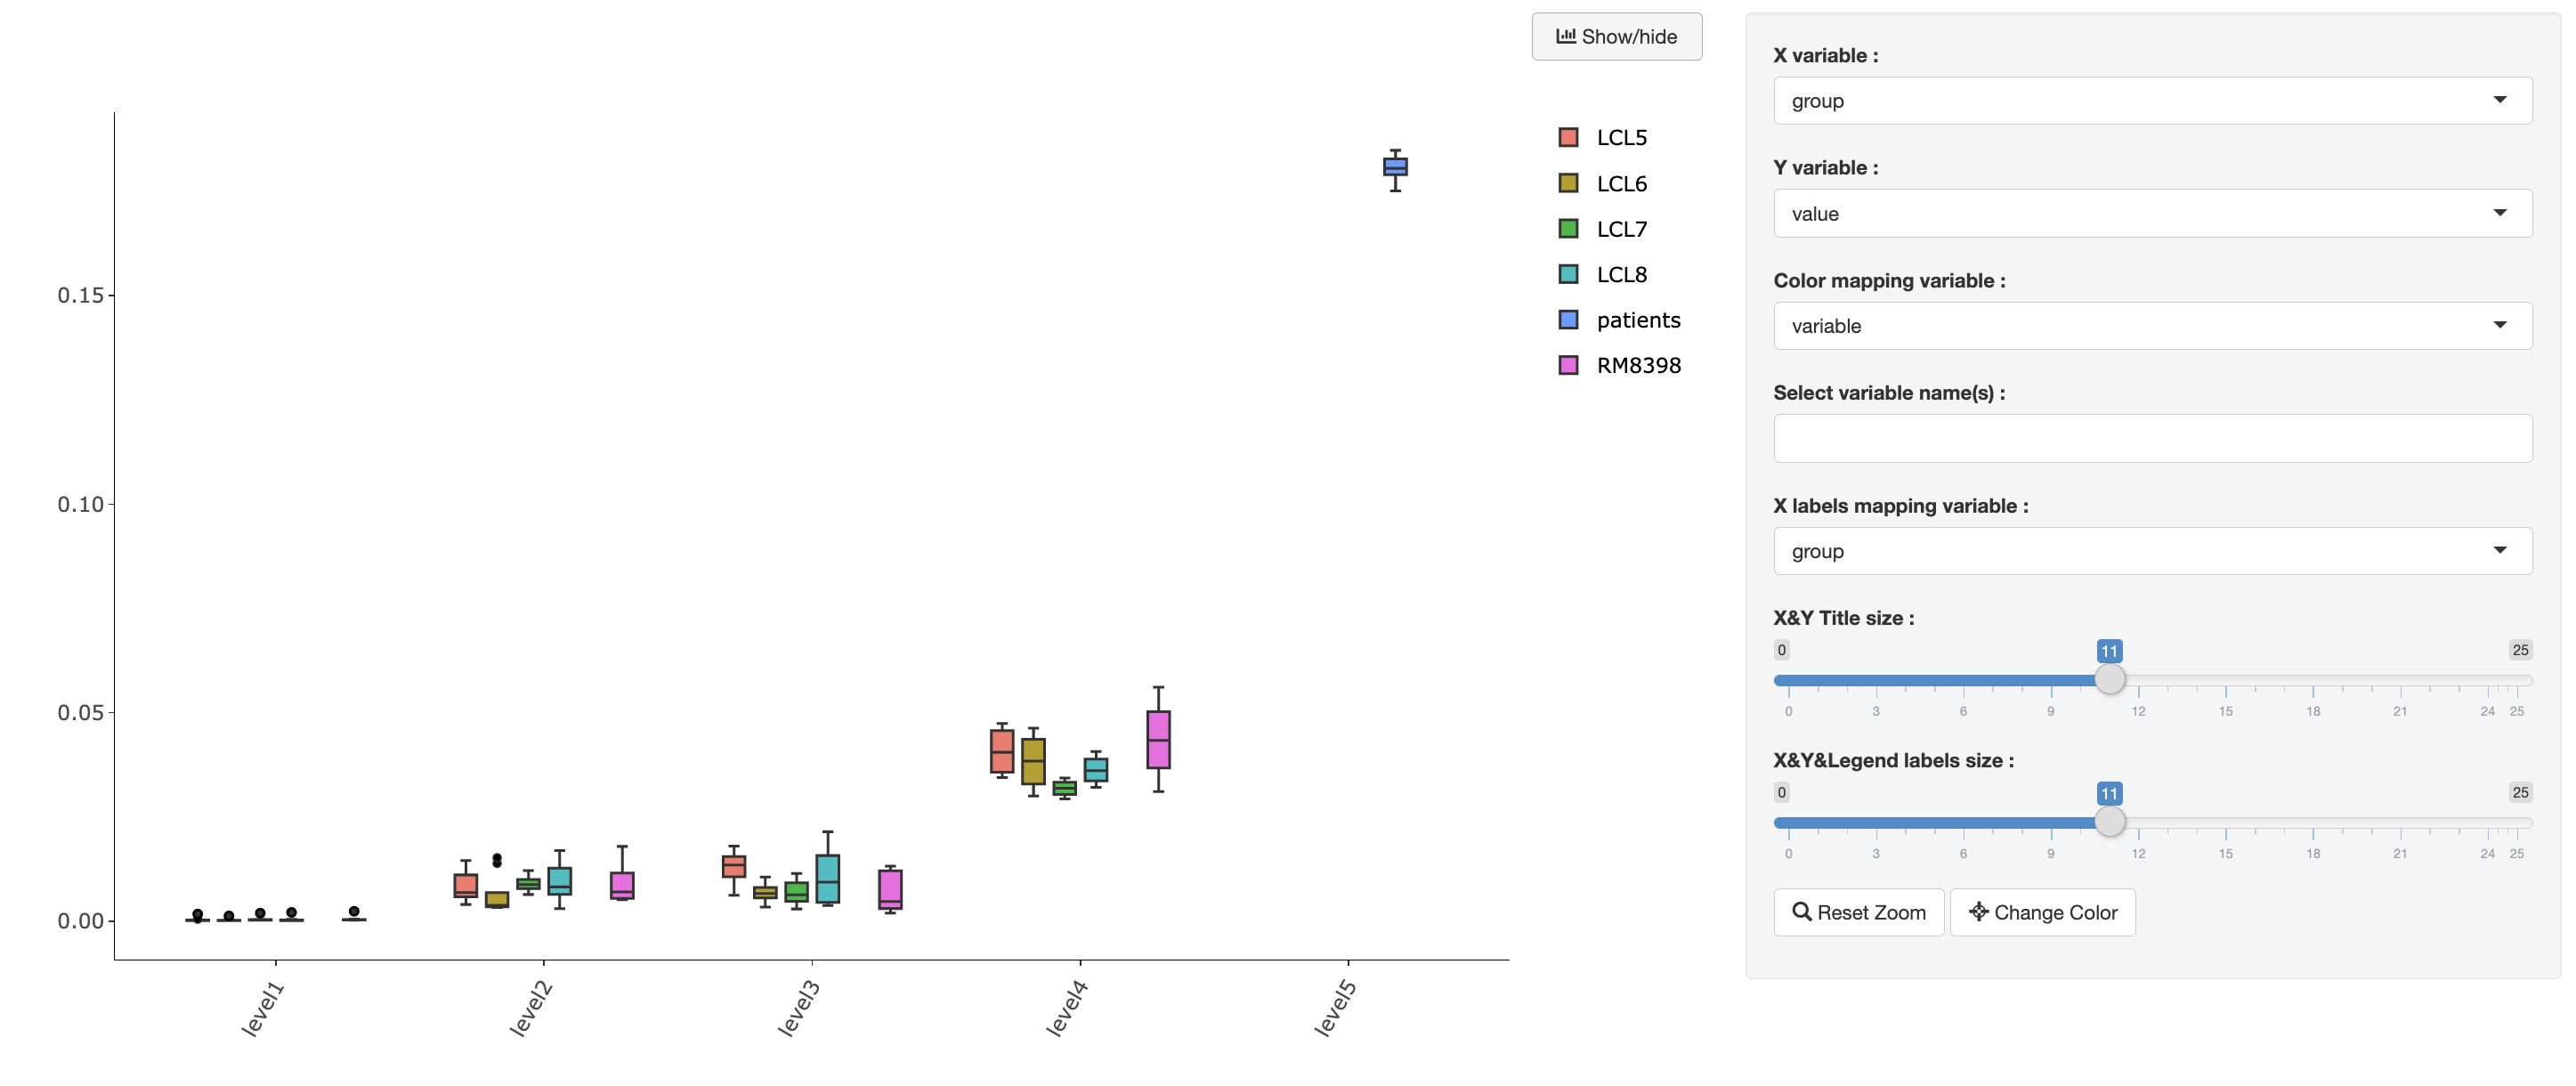
grouped-boxplot-r
ShowCase
Click the image to view the online example.
Description
Interactive grouped-boxplot visualization from a Shiny app(r version).
Example Data
group variable        value
level1     LCL5 0.0001517905
level1     LCL5 0.0001362790
level1     LCL5 0.0001263074
level1     LCL5 0.0001495745
level1     LCL5 0.0001296313
level1     LCL5 0.0002614785
level1     LCL5 0.0001983248
level1     LCL5 0.0001407109
level1     LCL5 0.0001329551
level5 patients 0.1844907818
level5 patients 0.1848652721
level5 patients 0.1793886279
level5 patients 0.1789997341
level5 patients 0.1771848963
level5 patients 0.1828177628
level5 patients 0.1822936979
level5 patients 0.1806162471
level5 patients 0.1804711044
level5 patients 0.1751396029
Usage
@grouped-boxplot-r(dataFile='dt_toplot.rds', dataType='rds', title='',
                   xAxis='group', xTitle='Group', yAxis='value', yTitle='Discordance',
                   colorAttr='variable', labelAttr='labels', legendTitle='Samples',
                   subtitle='', text='')
Arguments
; Configuration for group boxplot
[data]
; input data, may be a file or other data source.
; input data must be tidy data.
dataFile = dt_toplot.rds
; data file format
dataType = rds

[attributes]
; Shiny app title
title =
; The column name from data frame for x axis attribute
xAxis = group
xTitle =
; The column name from data frame for y axis attribute
yAxis = value
yTitle =
; The column name from data frame for color attribute
colorAttr = variable
; The column name from data frame for point label
labelAttr = labels
legendTitle = Samples
; query url
queryURL = https://www.duckduckgo.com/?q=
; subtitle and text for scatter chart
subtitle =
text =
Value
An interactive group box plot.
Author(s)
Jingcheng Yang(yjcyxky@163.com)
Examples
# If you need to show a default interactive plot by using sample data
@grouped-boxplot-r()

# If you have a custom data, you need to reset these arguments at least.
@grouped-boxplot-r(dataFile='dt_toplot.rds', dataType='rds', xAxis='group', yAxis='value')
Last update:
2022-06-04
