density-plot-r
ShowCase
Online example will be available soon.
Description
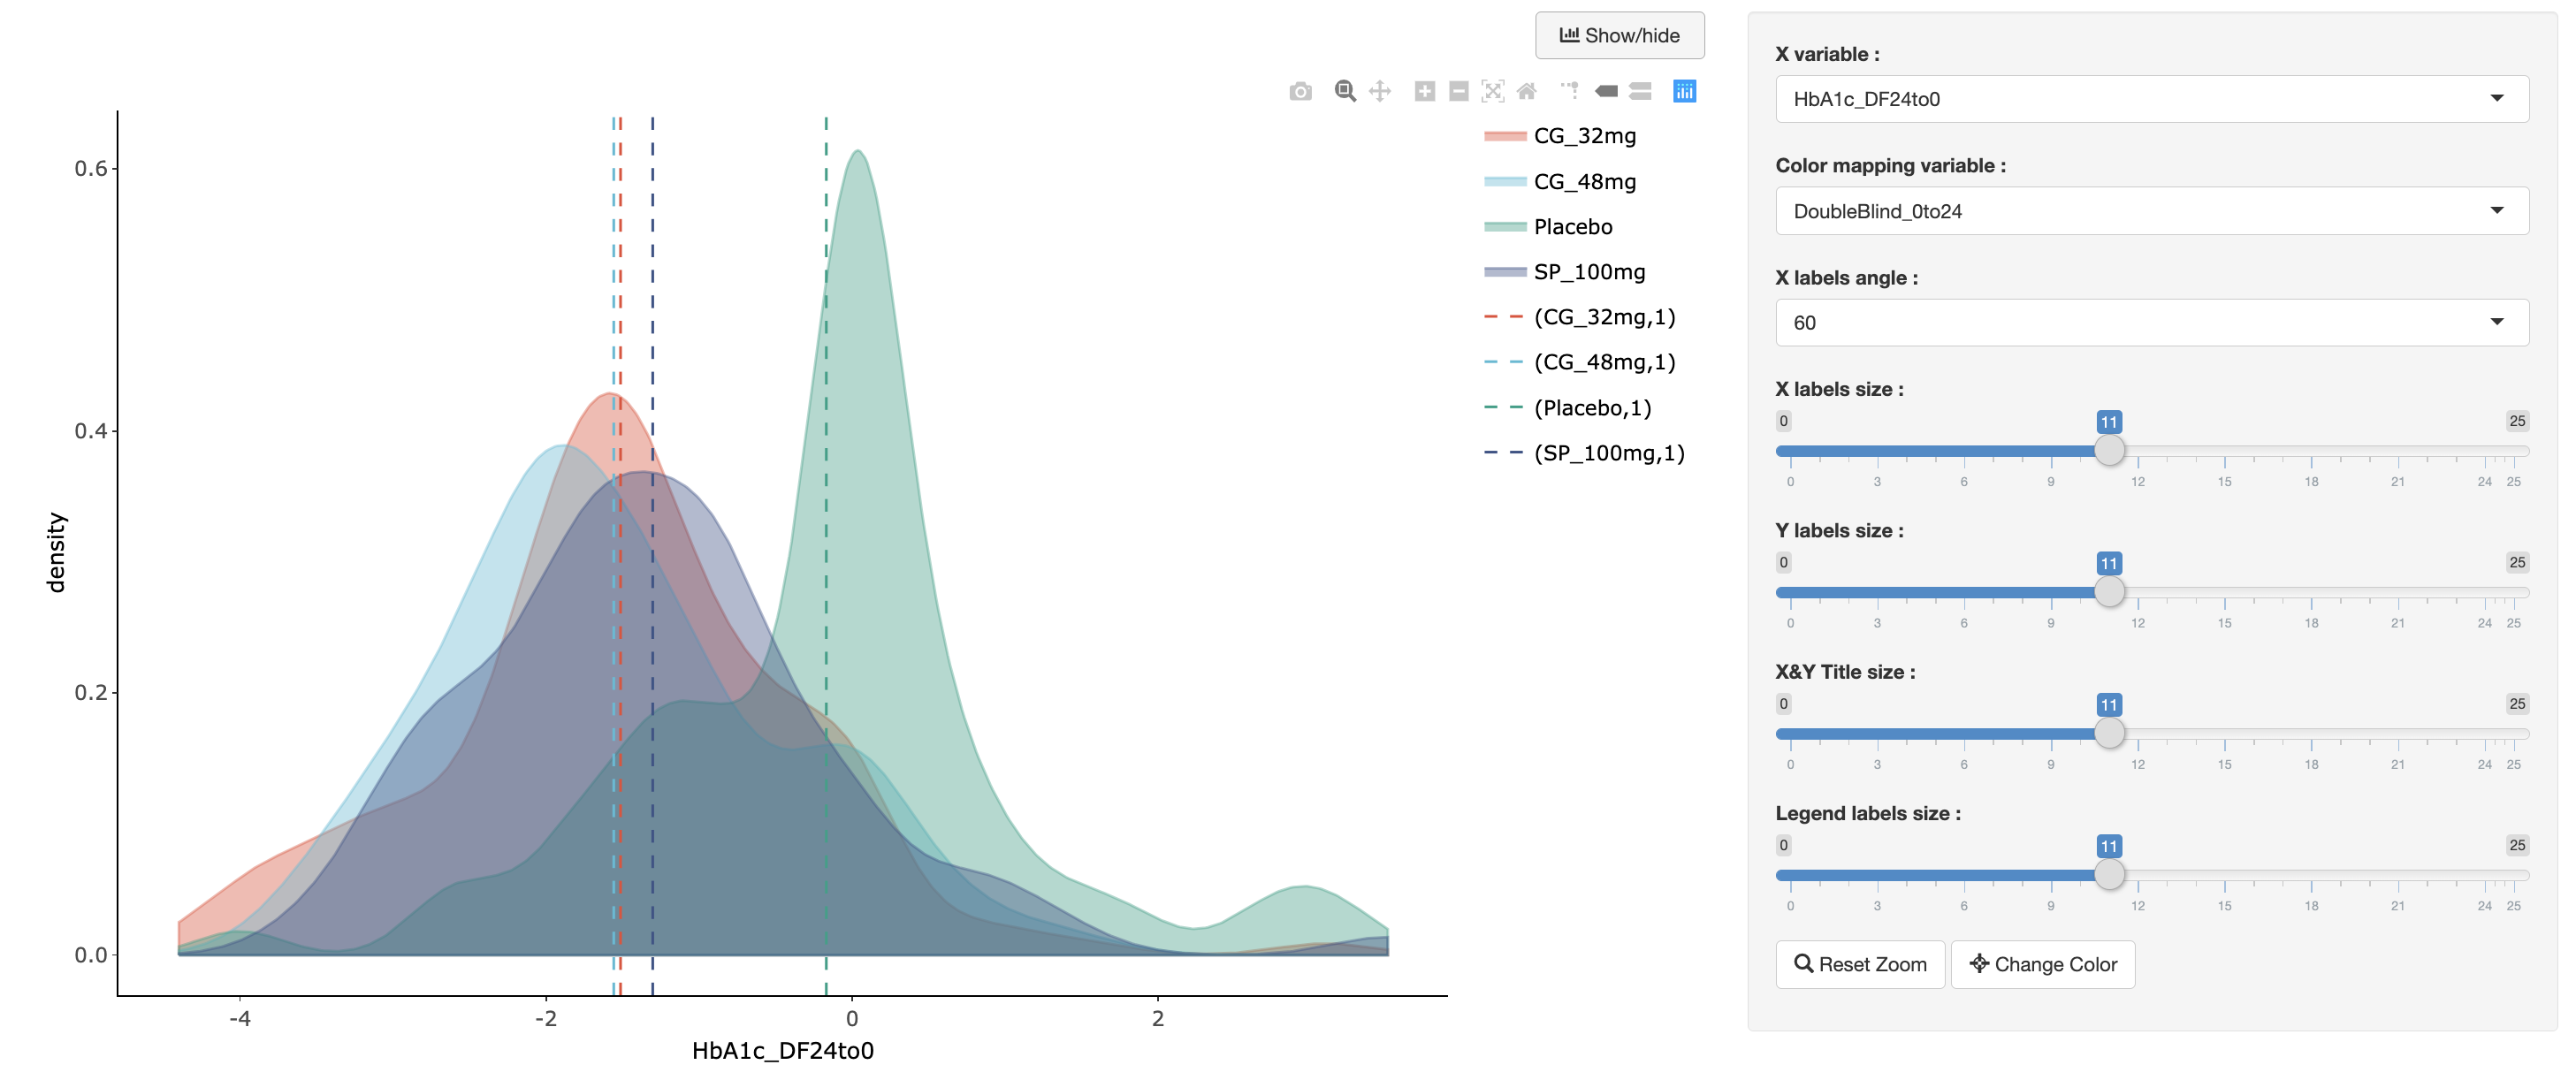
Interactive density plot visualization from a Shiny app(r version).
Example Data
ScreenID Patient Protocol Site     Birth Age Gender DoubleBlind_0to24 Extended_24to52 HbA1c_DF24to0
10010001    1001   CGZ301 1001 1972/12/7  41 Female           Placebo    Placebo_48mg           1.1
10010002    1002   CGZ301 1001 1951/10/8  62   Male           CG_32mg         CG_32mg           0.0
10010004    1003   CGZ301 1001 1956/1/27  58   Male           Placebo    Placebo_32mg           1.6
10010003    1004   CGZ301 1001 1956/2/13  58   Male           CG_32mg         CG_32mg          -0.4
10010005    1005   CGZ301 1001 1952/2/23  62   Male           CG_48mg         CG_48mg          -1.3
10010006    1006   CGZ301 1001 1973/10/6  40   Male           CG_48mg         CG_48mg          -1.8
10030004    1007   CGZ301 1003  1979/2/5  35   Male           CG_32mg         CG_32mg          -1.1
10030003    1010   CGZ301 1003 1982/5/23  32   Male           Placebo    Placebo_48mg          -1.7
10030002    1011   CGZ301 1003  1970/4/4  44   Male           Placebo    Placebo_32mg          -0.6
10030012    1012   CGZ301 1003 1957/8/20  57 Female           CG_32mg         CG_32mg          -1.9
10110004    1013   CGZ301 1011 1974/2/28  40   Male           CG_32mg         CG_32mg          -1.2
10110003    1014   CGZ301 1011 1961/7/26  53 Female           Placebo    Placebo_32mg          -1.4
Usage
@density-plot-r(dataFile='dt_toplot.rds', dataType='rds', title='',
                xAxis='DoubleBlind_0to24', xTitle='DoubleBlind_0to24',
                colorAttr='DoubleBlind_0to24', subtitle='', text='',
                fillEnable=True)
Arguments
; input data, may be a file or other data source.
; input data must be tidy data.
dataFile = boxplot-r.rds
; data file format
dataType = rds
; Shiny app title
title =
; The column name from data frame for x axis attribute
xAxis = DoubleBlind_0to24
xTitle =
; The column name from data frame for color attribute
colorAttr = DoubleBlind_0to24
; query url(unsupported in the current version.)
queryURL = https://www.duckduckgo.com/?q=
; Fill color or not
fillEnable = True
; subtitle and text for scatter chart
subtitle =
text =
Value
An interactive density plot.
Author(s)
Jingcheng Yang(yjcyxky@163.com)
Examples
# If you need to show a default interactive plot by using sample data
@density-plot-r()

# If you have a custom data, you need to reset these arguments at least.
@density-plot-r(dataFile='boxplot-r.rds', dataType='rds', xAxis='DoubleBlind_0to24')
Last update:
2022-06-04