tabulator-js
ShowCase
Online example will be available soon.
Description
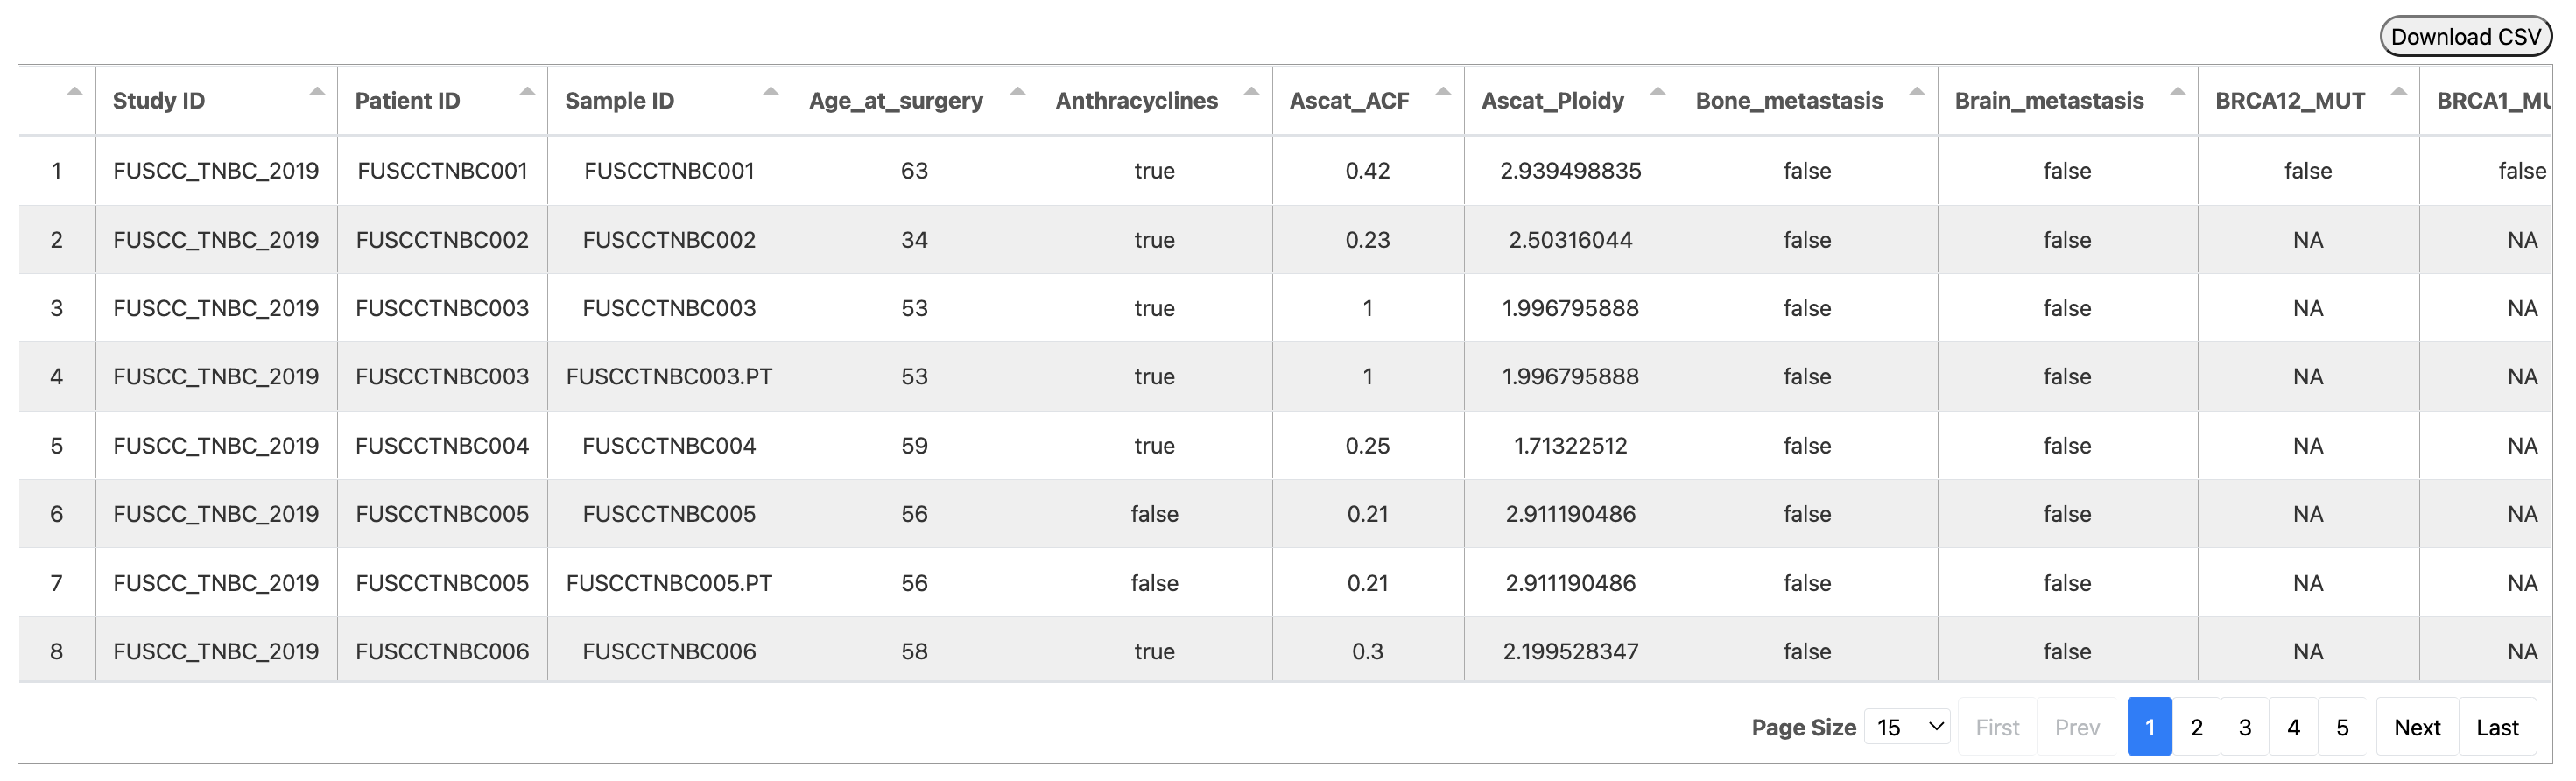
Interactive table. It is based on js library tabulator.
Example Data
Download the example data which is from the Chinese Triple-Negative Breast Cancer cohort (Jiang, et al., Cancer Cell, 2019).
| Study ID | Patient ID | Sample ID | Age_at_surgery | Anthracyclines | Ascat_ACF | Ascat_Ploidy | Bone_metastasis | Brain_metastasis | BRCA12_MUT | BRCA1_MUT | BRCA2_MUT | Chemotherapy | Chemotherapy_other_regimen | Chemotherapy_regimen_unknown | CNA_Subtype | Contralateral_supraclavicular_LN_metastasis | Date_of_last_followup | Date_of_surgery | RFS_time_Months | RFS_Status | DNA_QC_Failed | ERBB2_FISH | ERBB2_IHC_score | ER_IHC_score | Exome_Seqencing | Fibrosis | Followup_Month | Fraction Genome Altered | Grade | Histology | Histology_extended | HRD | HTA_ID | iCluster_Subtype | Internal_mammary_LN_metastasis | Intrinsic_Subtype | iTILs | Kbase Identifier | Ki67 | LC3B_ZS | Live_metastasis | LN_examed | LN_positive | LOH | Lost | LSTm | Lung_metastasis | Menopause | mRNA_Subtype | Mutation Count | Mutation_Subtype | Mutation_Subtype_Old | N | Necrosis | Note | No_Chemotherapy | OncoScan_Array | Paclitaxel | Perineural_invasion | Platins | PR_IHC_score | Radiotherapy | RFS_time_Days | RNA_Seqencing | Number of Samples Per Patient | Sex | Size_cm | SNF_Subtype | sTILs | Surgery | T | Telomeric_AI | tissue_type |
|---|---|---|---|---|---|---|---|---|---|---|---|---|---|---|---|---|---|---|---|---|---|---|---|---|---|---|---|---|---|---|---|---|---|---|---|---|---|---|---|---|---|---|---|---|---|---|---|---|---|---|---|---|---|---|---|---|---|---|---|---|---|---|---|---|---|---|---|---|---|---|---|---|---|
| FUSCC_TNBC_2019 | FUSCCTNBC001 | FUSCCTNBC001 | 63 | TRUE | 0.42 | 2.939498835 | FALSE | FALSE | FALSE | FALSE | FALSE | TRUE | FALSE | FALSE | Low_CIN | FALSE | 2016/1/28 | 2011/11/1 | 51.6 | 0:DiseaseFree | FALSE | NA | 0 | Negative | YES | NA | 50.9260274 | 0.1729 | NA | MC | NA | 20.43776806 | NA | iC6 | FALSE | Basal | 10 | 1 | 30 | NA | FALSE | 18 | 0 | 13 | FALSE | 6.437768063 | FALSE | TRUE | IM | 111 | HRD | HRD | 0 | NA | None | FALSE | YES | FALSE | FALSE | FALSE | Negative | FALSE | 1549 | YES | 1 | Female | 4 | SC2 | 10 | MRM | 2 | 1 | tumor |
| FUSCC_TNBC_2019 | FUSCCTNBC002 | FUSCCTNBC002 | 34 | TRUE | 0.23 | 2.50316044 | FALSE | FALSE | NA | NA | NA | TRUE | FALSE | FALSE | Chr9p23_amp | FALSE | 2017/6/30 | 2014/5/30 | 37.6 | 0:DiseaseFree | FALSE | Negative | 1 | Negative | YES | NA | 37.05205479 | 0.0723 | NA | IDC | NA | 31.20101318 | NA | NA | FALSE | NA | 0 | 2 | 70 | NA | FALSE | 20 | 0 | 8 | FALSE | 17.20101318 | FALSE | FALSE | NA | 29 | Clock_like | Aging | 0 | NA | NAC | FALSE | YES | FALSE | NA | FALSE | Negative | FALSE | 1127 | NA | 1 | Female | 2 | NA | 10 | MRM | 1 | 6 | tumor |
| FUSCC_TNBC_2019 | FUSCCTNBC003 | FUSCCTNBC003 | 53 | TRUE | 1 | 1.996795888 | FALSE | FALSE | NA | NA | NA | TRUE | FALSE | FALSE | NA | FALSE | 2017/6/30 | 2014/8/6 | 35.3 | 0:DiseaseFree | TRUE | Negative | 2 | Negative | NA | NA | 34.81643836 | 0.0010 | 3 | Others | With_Apocrine_Feature | -30.95033627 | NA | NA | FALSE | Other | NA | 3 | 25 | NA | FALSE | 16 | 0 | 0 | FALSE | -30.95033627 | FALSE | FALSE | LAR | NA | NA | NA | 0 | NA | None | FALSE | NA | TRUE | NA | FALSE | Negative | FALSE | 1059 | YES | 2 | Female | 2 | NA | NA | MTX | 1 | 0 | tumor |
| ... | ... | ... | ... | ... | ... | ... | ... | ... | ... | ... | ... | ... | ... | ... | ... | ... | ... | ... | ... | ... | ... | ... | ... | ... | ... | ... | ... | ... | ... | ... | ... | ... | ... | ... | ... | ... | ... | ... | ... | ... | ... | ... | ... | ... | ... | ... | ... | ... | ... | ... | ... | ... | ... | ... | ... | ... | ... | ... | ... | ... | ... | ... | ... | ... | ... | ... | ... | ... | ... | ... | ... | ... | ... |
Usage
Arguments
Value
An interactive table.
Author(s)
Jingcheng Yang(yjcyxky@163.com)
Examples
# If you have a custom data, you need to reset these arguments at least.
@tabulator(dataUrl='https://cdn.biovis.report/examples/data/data_clinical_patient.csv')

# If you have a custom data in your local directory, you can load it with relative path or absolute path
@tabulator(dataUrl='./your-custom-data.csv')
Last update:
2022-06-04