pie-chart-js
ShowCase
Online example will be available soon.
Description
Interactive pie chart. It is based on echarts.
Example Data
Download the example data.
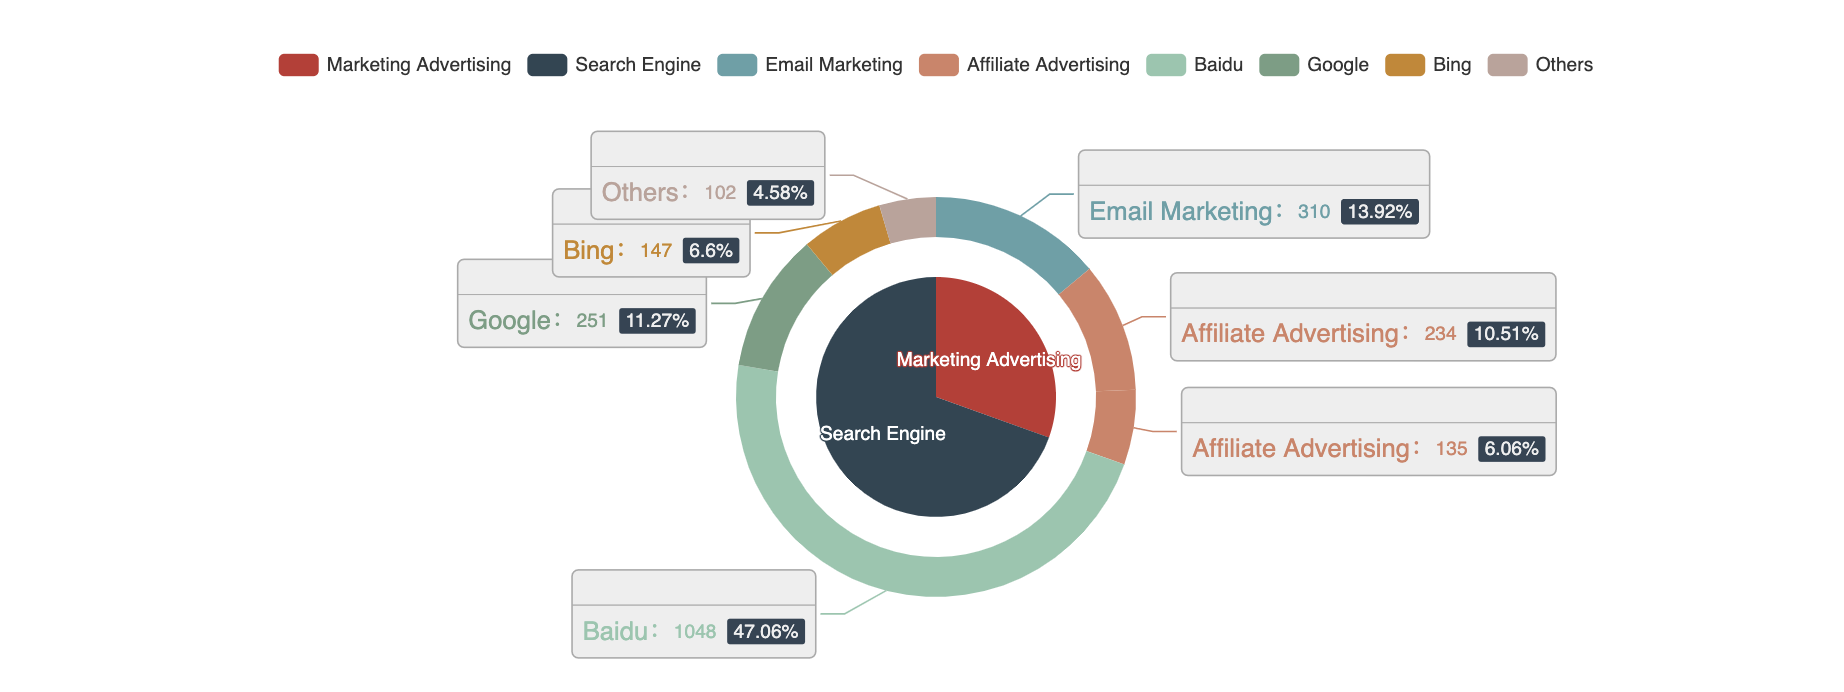
| group | subgroup | value |
|---|---|---|
| Marketing Advertising | Email Marketing | 310 |
| Marketing Advertising | Affiliate Advertising | 234 |
| Marketing Advertising | Affiliate Advertising | 135 |
| Search Engine | Baidu | 1048 |
| Search Engine | 251 | |
| Search Engine | Bing | 147 |
| Search Engine | Others | 102 |
Usage
@pie-chart-js(dataUrl="example_data.csv", group="group", subgroup="subgroup",
              value="value", title="title", radius=30, chartName="Chart Name",
              legendOrient="horizontal", legendPosition="right", selectedMode="single")
Arguments
dataUrl: [string] Your own file with CSV data by specifying the URL/Local Path to your file.
group: column name that is mapped to group column.
subgroup: column name that is mapped to subgroup column.
value: column name that is mapped to value column.
title: chart title.
radius: circle radius.
chartName: chart name.
legendOrient: "horizontal", "vertical"
legendPosition: "right", "left"
selectedMode: "single", "multiple"
Value
An interactive pie chart.
Author(s)
Jingcheng Yang(yjcyxky@163.com)
Examples
# If you have a custom data, you need to reset these arguments at least.
@pie-chart-js(dataUrl='example_data.csv')

# More arguments
@pie-chart-js(dataUrl='example_data.csv', group="group", subgroup="subgroup",
              value="value", title="title", radius=30, chartName="Chart Name",
              legendOrient="horizontal", legendPosition="right", selectedMode="single")
Last update:
2022-06-04