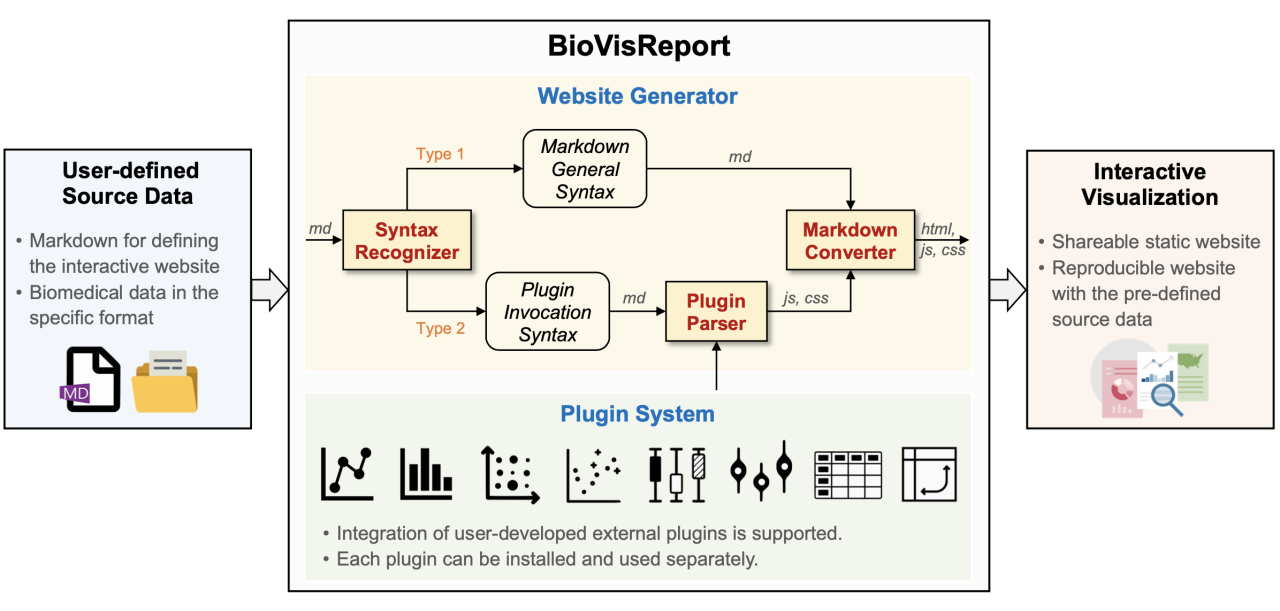
Introduction
All plugins are divided into three plugin packages depending on the development language:
biovis-rbased-plugins: Those plugins whose names all end in -r and are developed based on the R language with the shiny library. These plugins usually have complex dependencies and do not work on static HTML pages. However, they can interact with the server to achieve complex functionality.
biovis-pybased-plugins: Those plugins whose names all end in -py and are developed based on the Python language.
biovis-jsbased-plugins: Those plugins whose names all end in -js and are developed based on the JavaScript language. These plugins can work on static HTML pages.
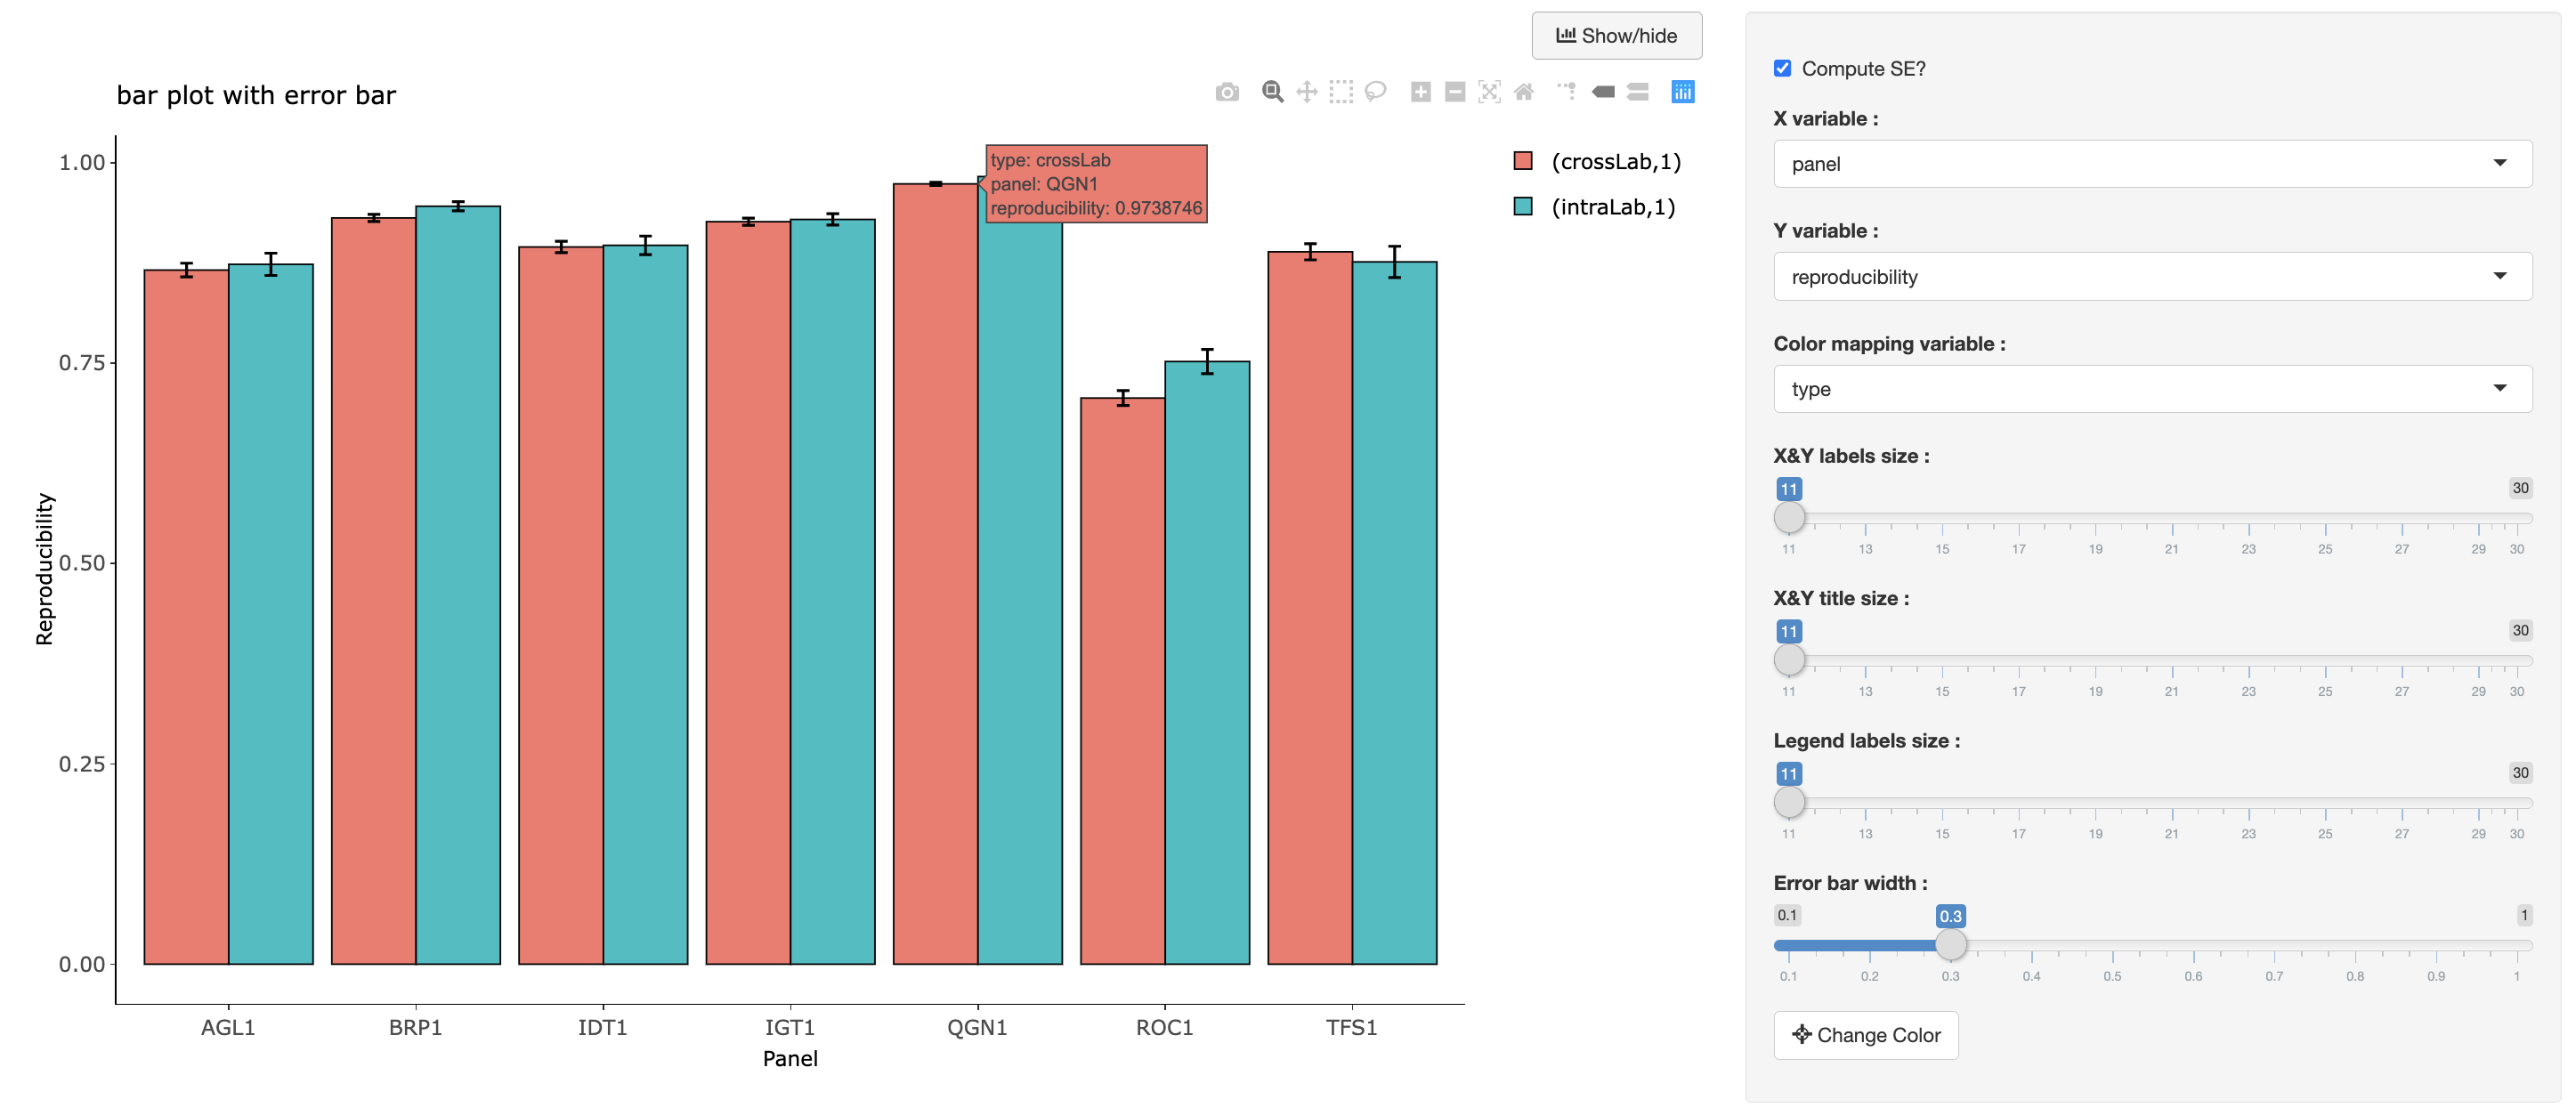
barplot-r
Interactive bar plot visualization from a Shiny app
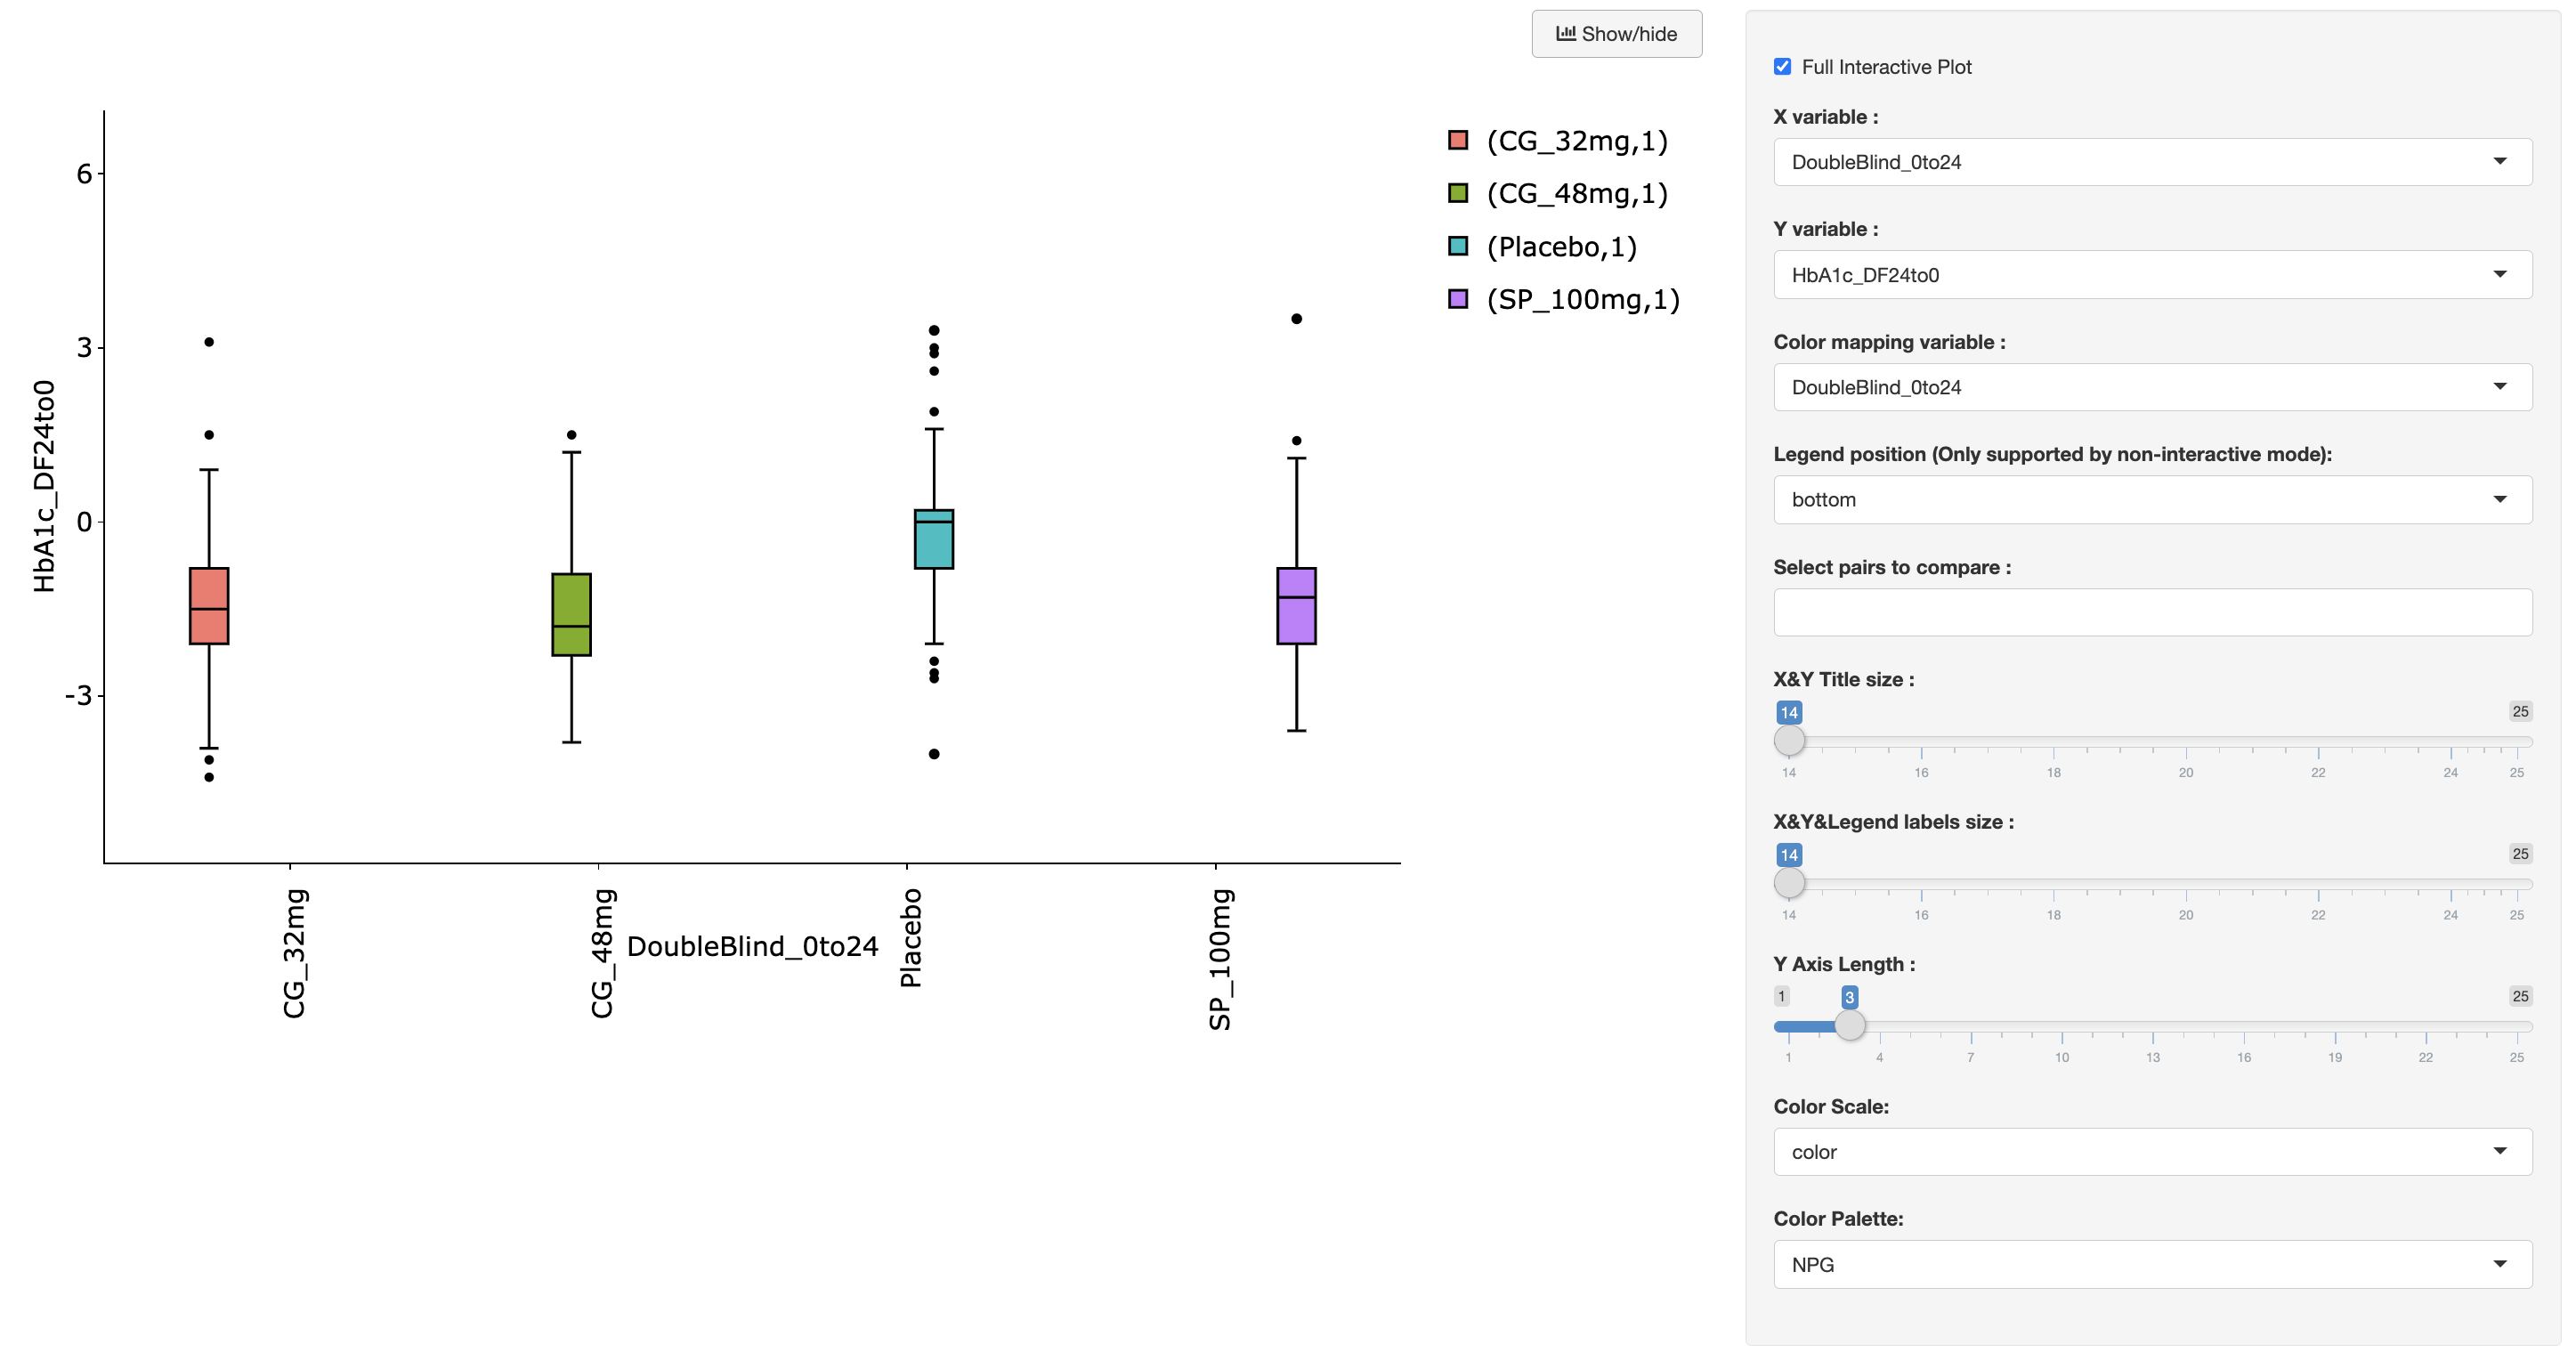
boxplot-r
Interactive boxplot visualization from a Shiny app
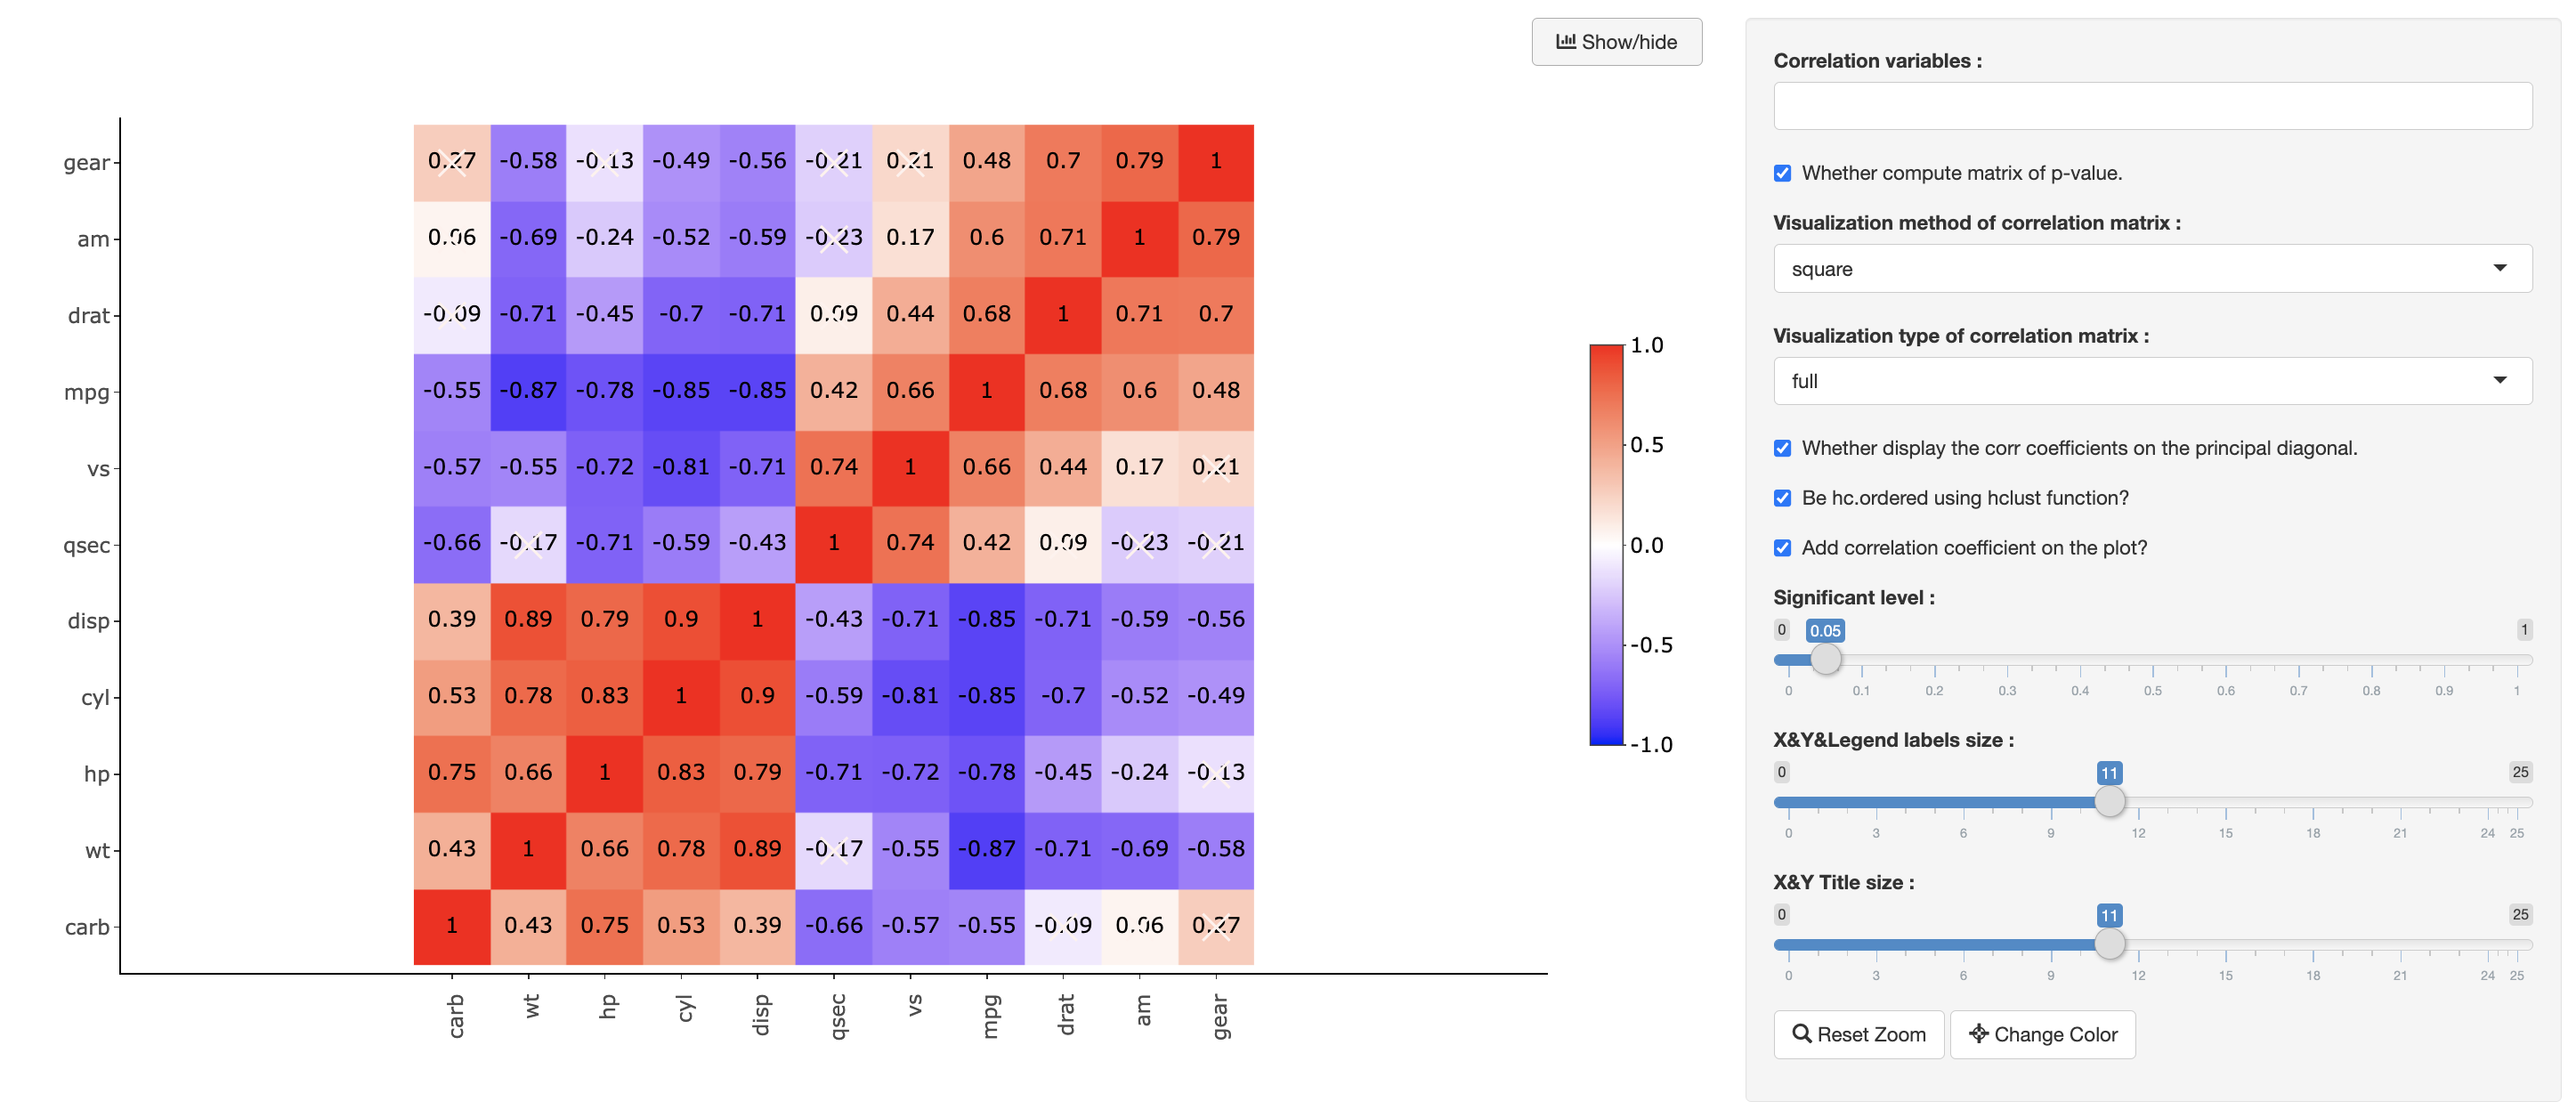
corrplot-r
Interactive correlation plot visualization from a Shiny app
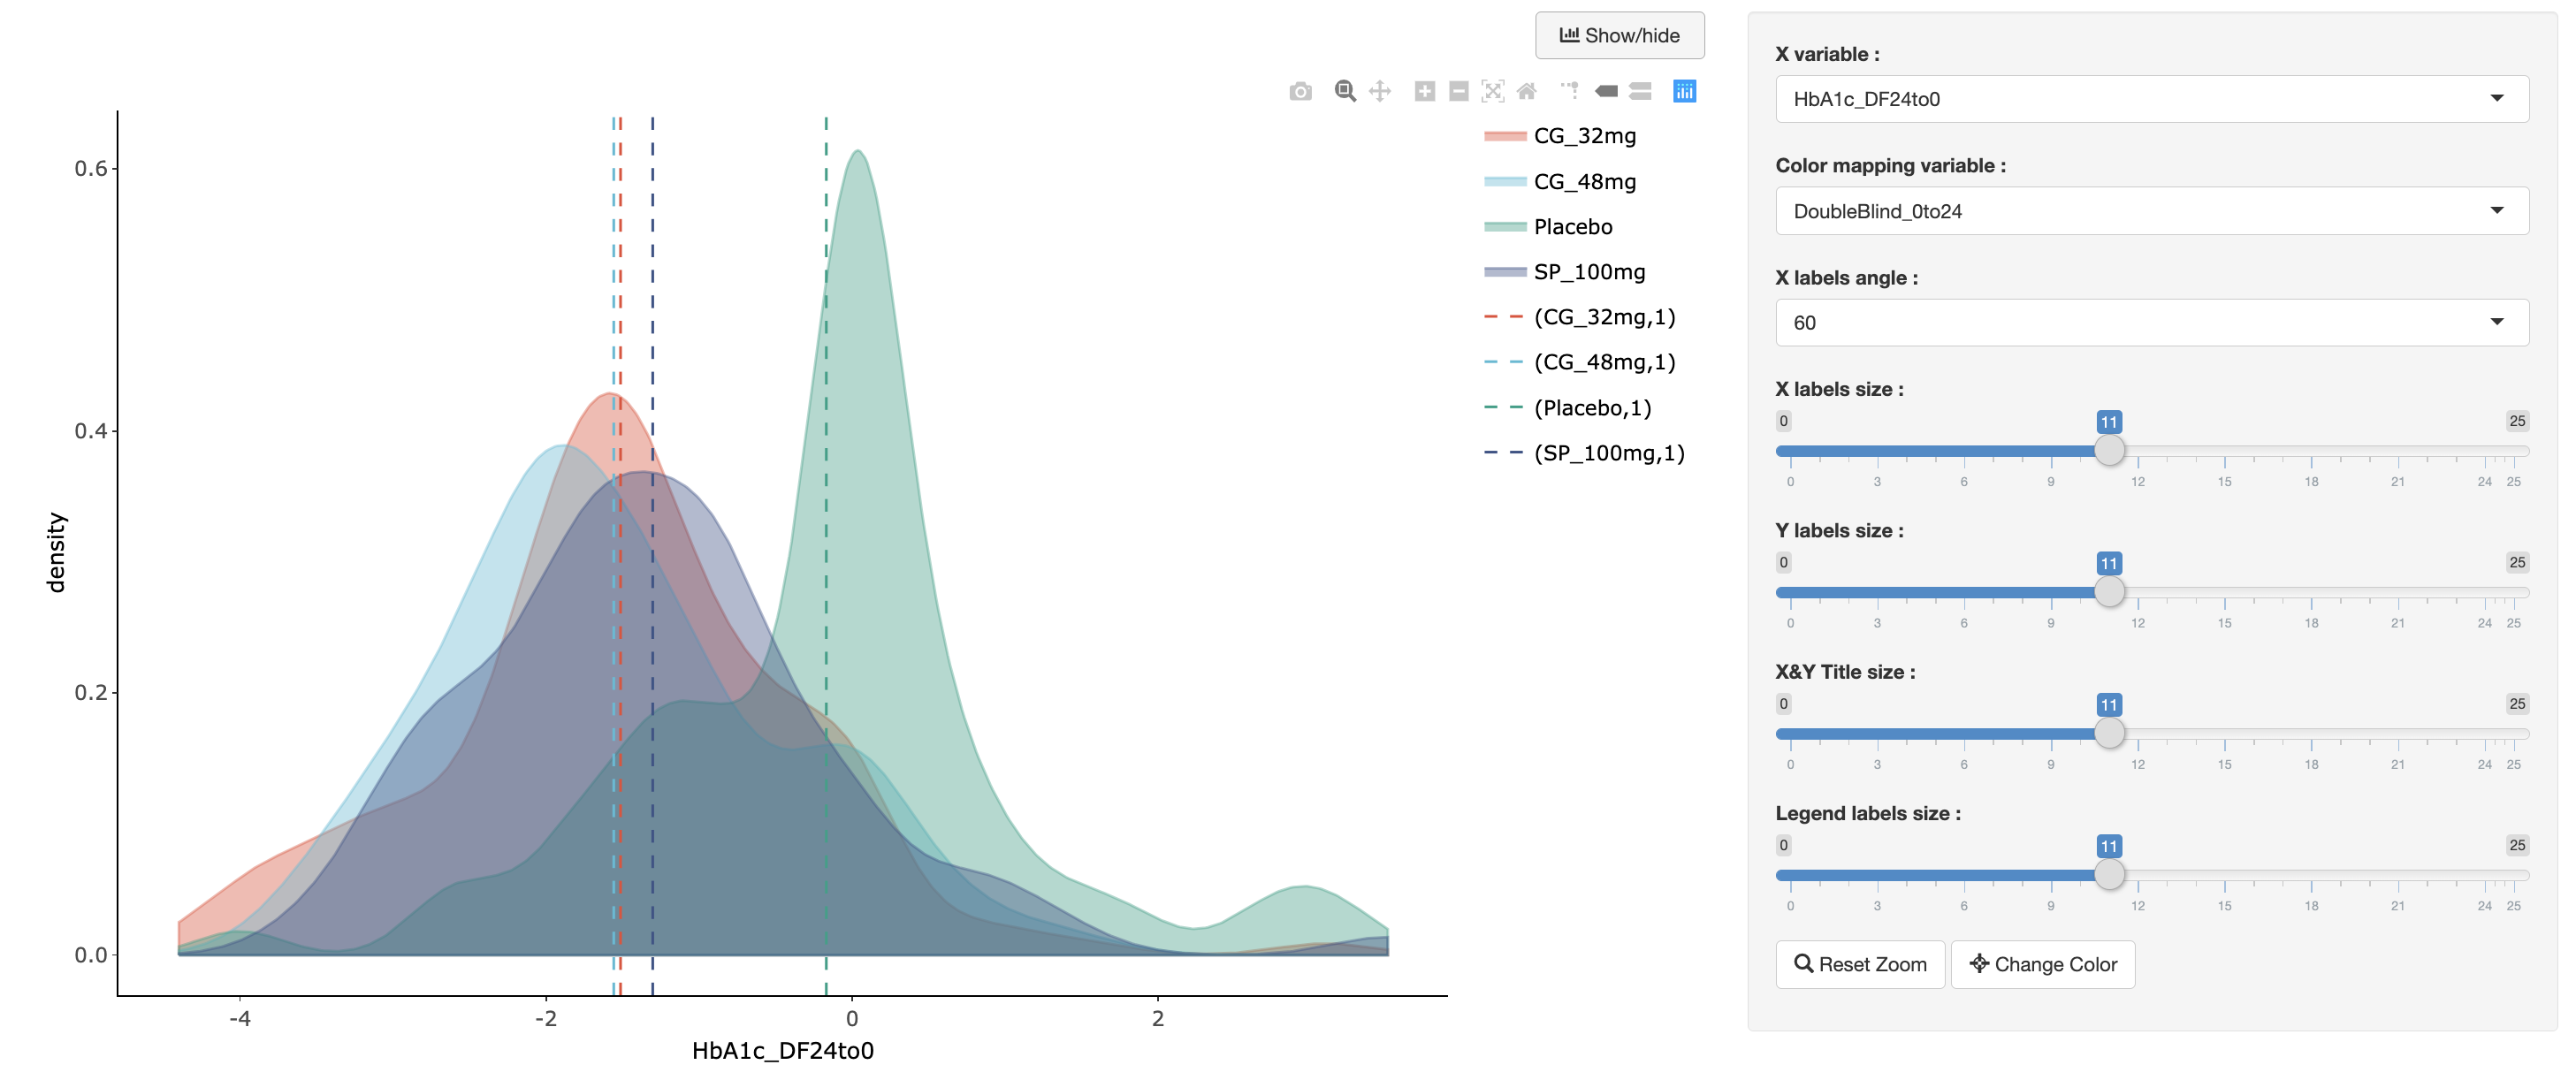
density-plot-r
Interactive density plot visualization from a Shiny app
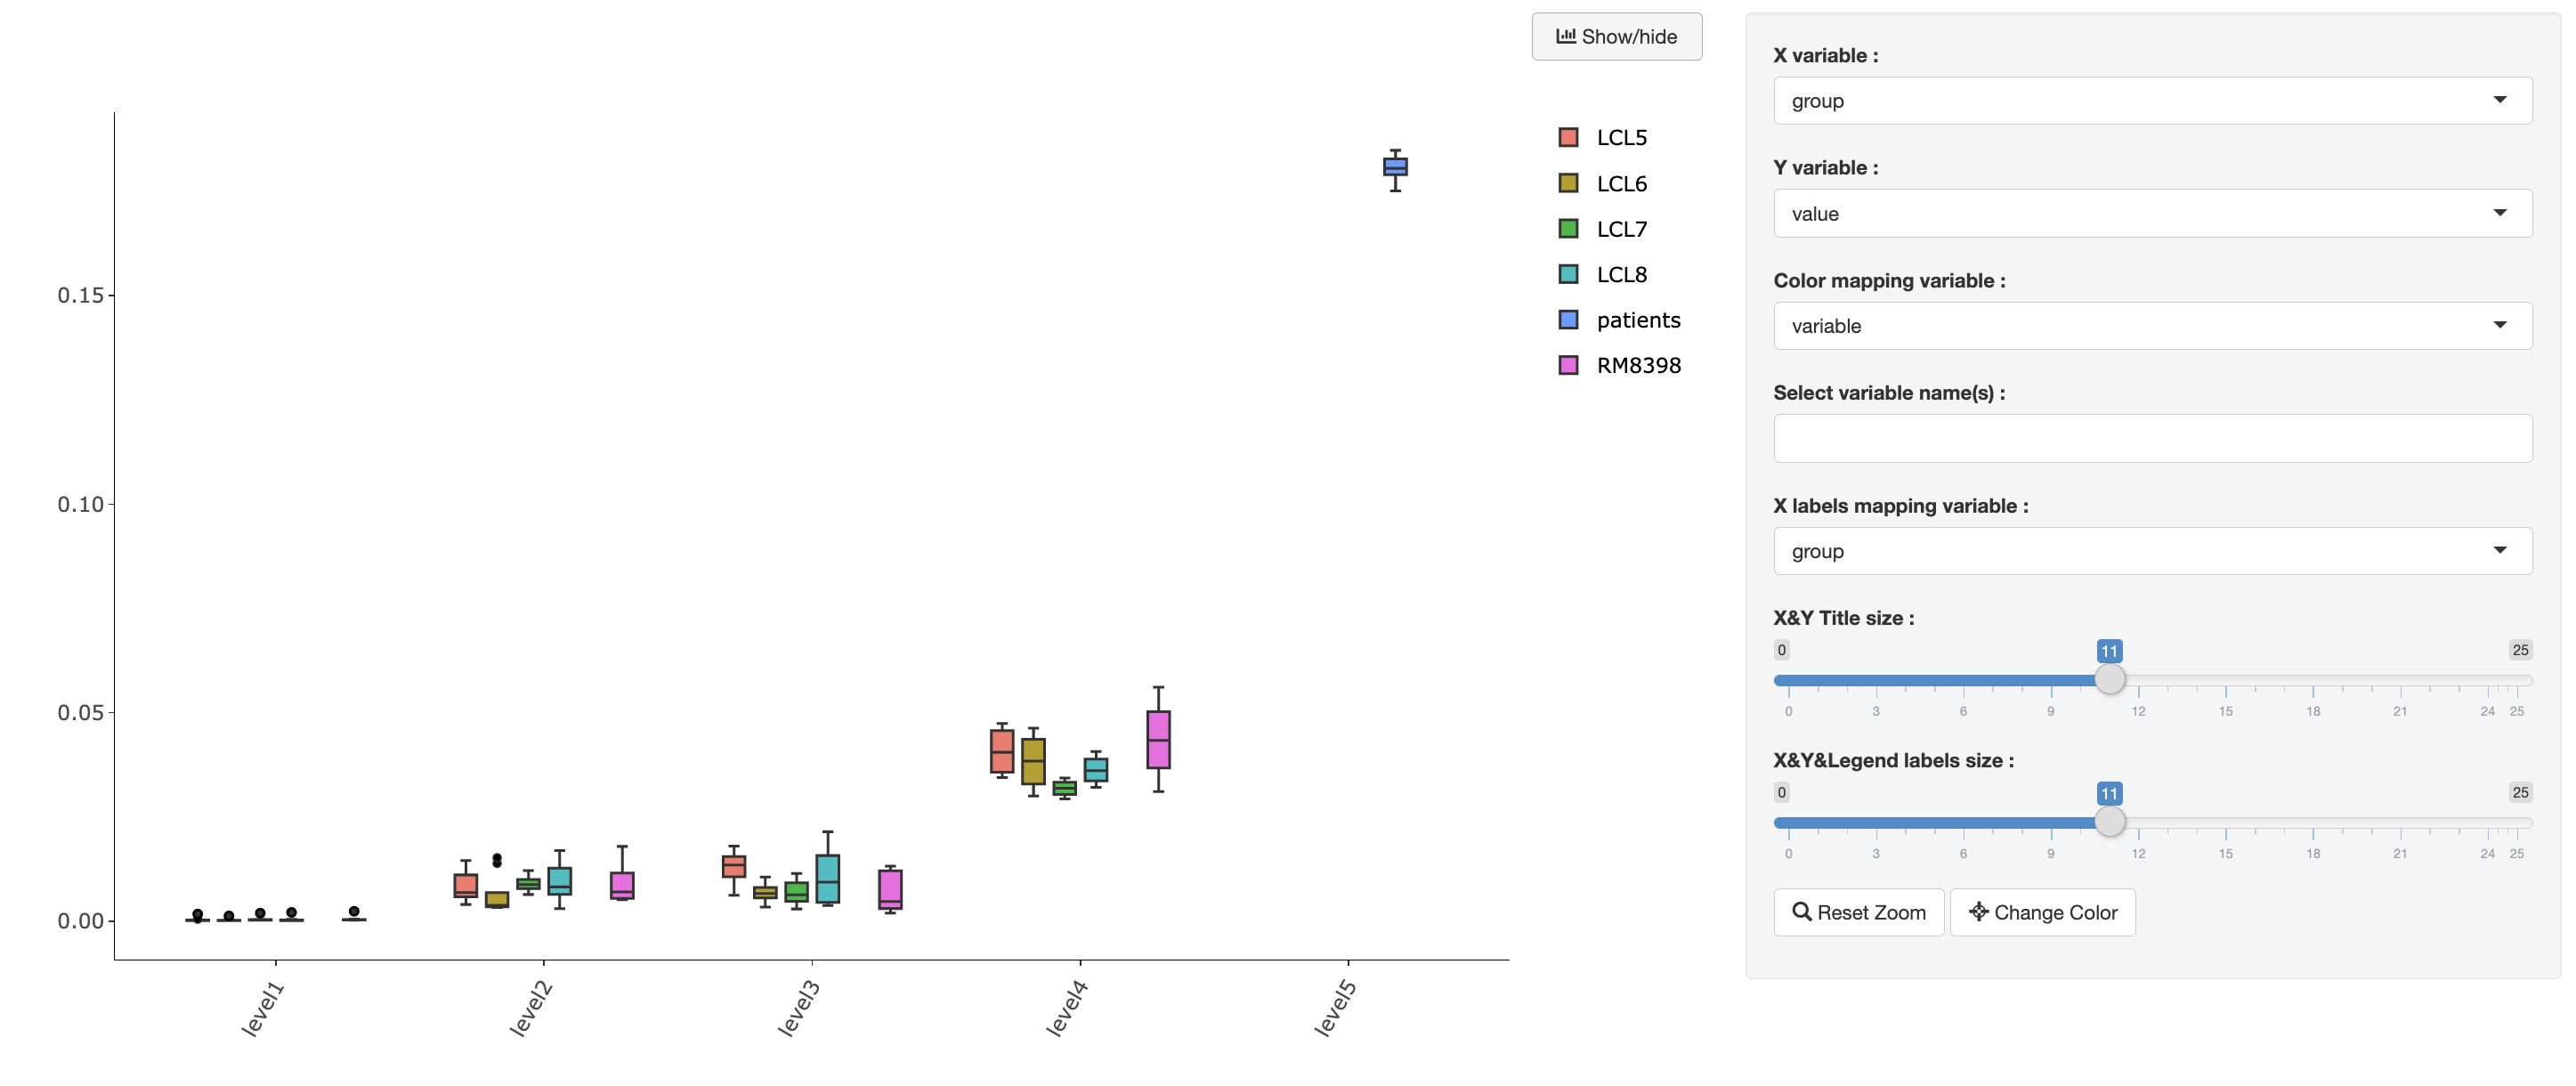
grouped-boxplot-r
Interactive grouped-boxplot visualization from a Shiny app
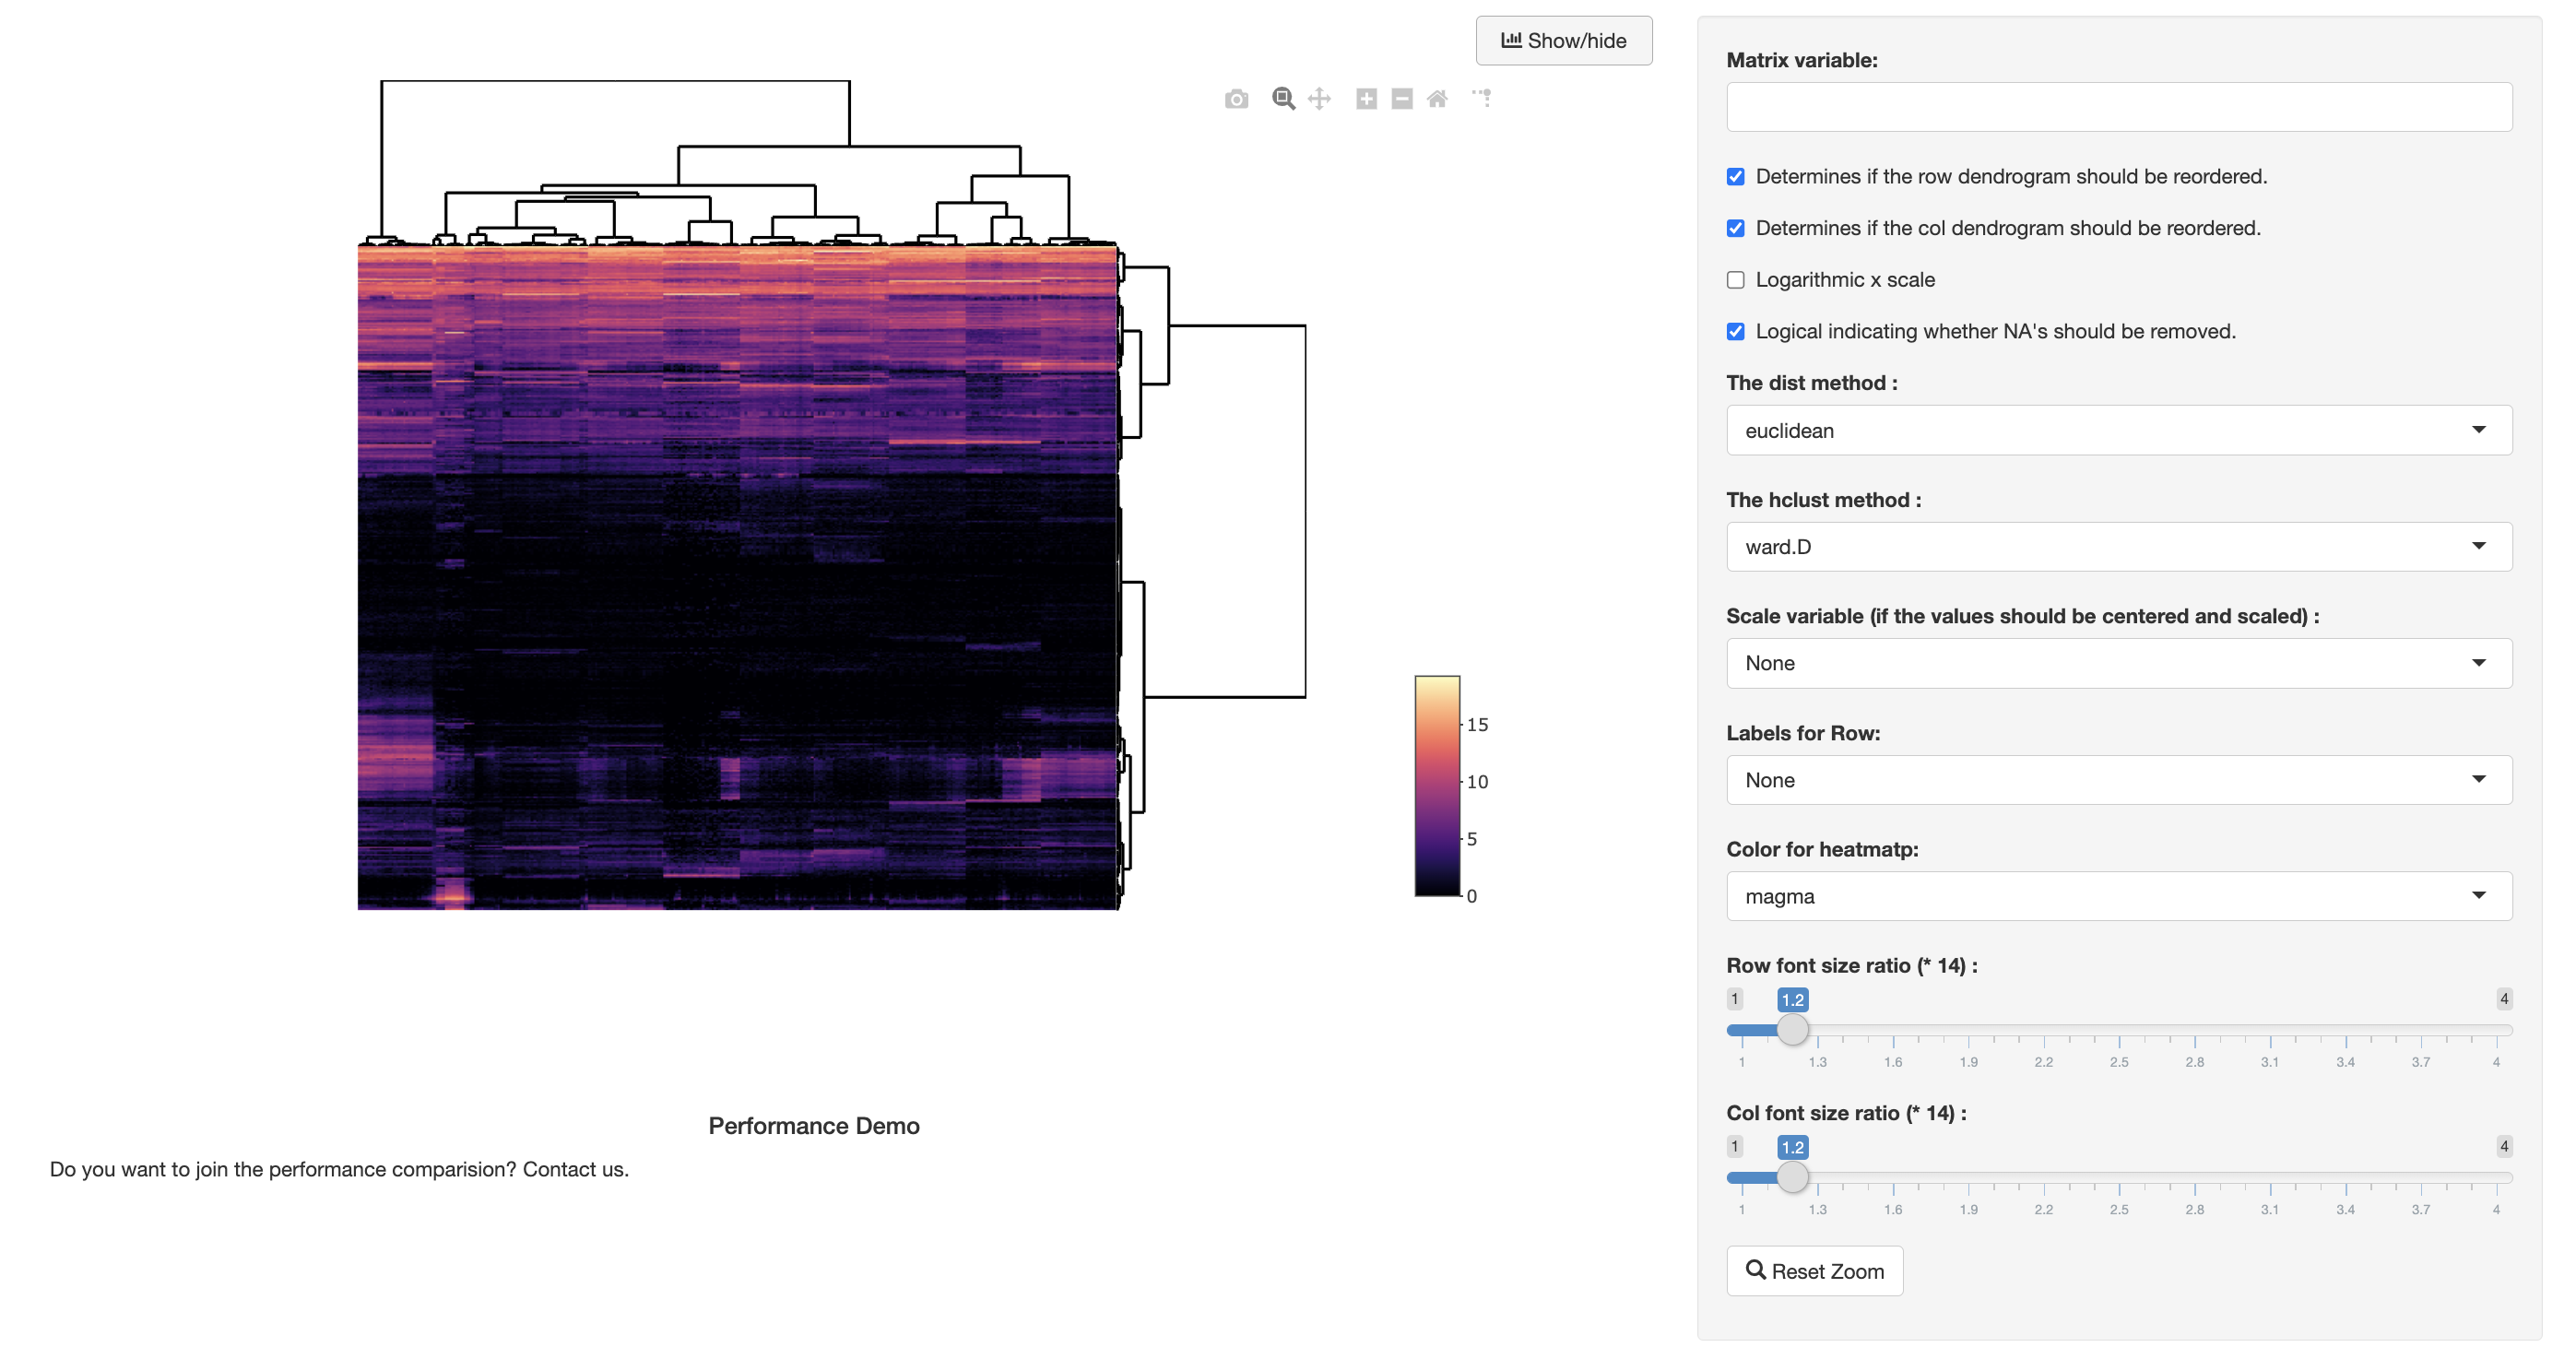
heatmap-r
Interactive heatmap based on heatmaply
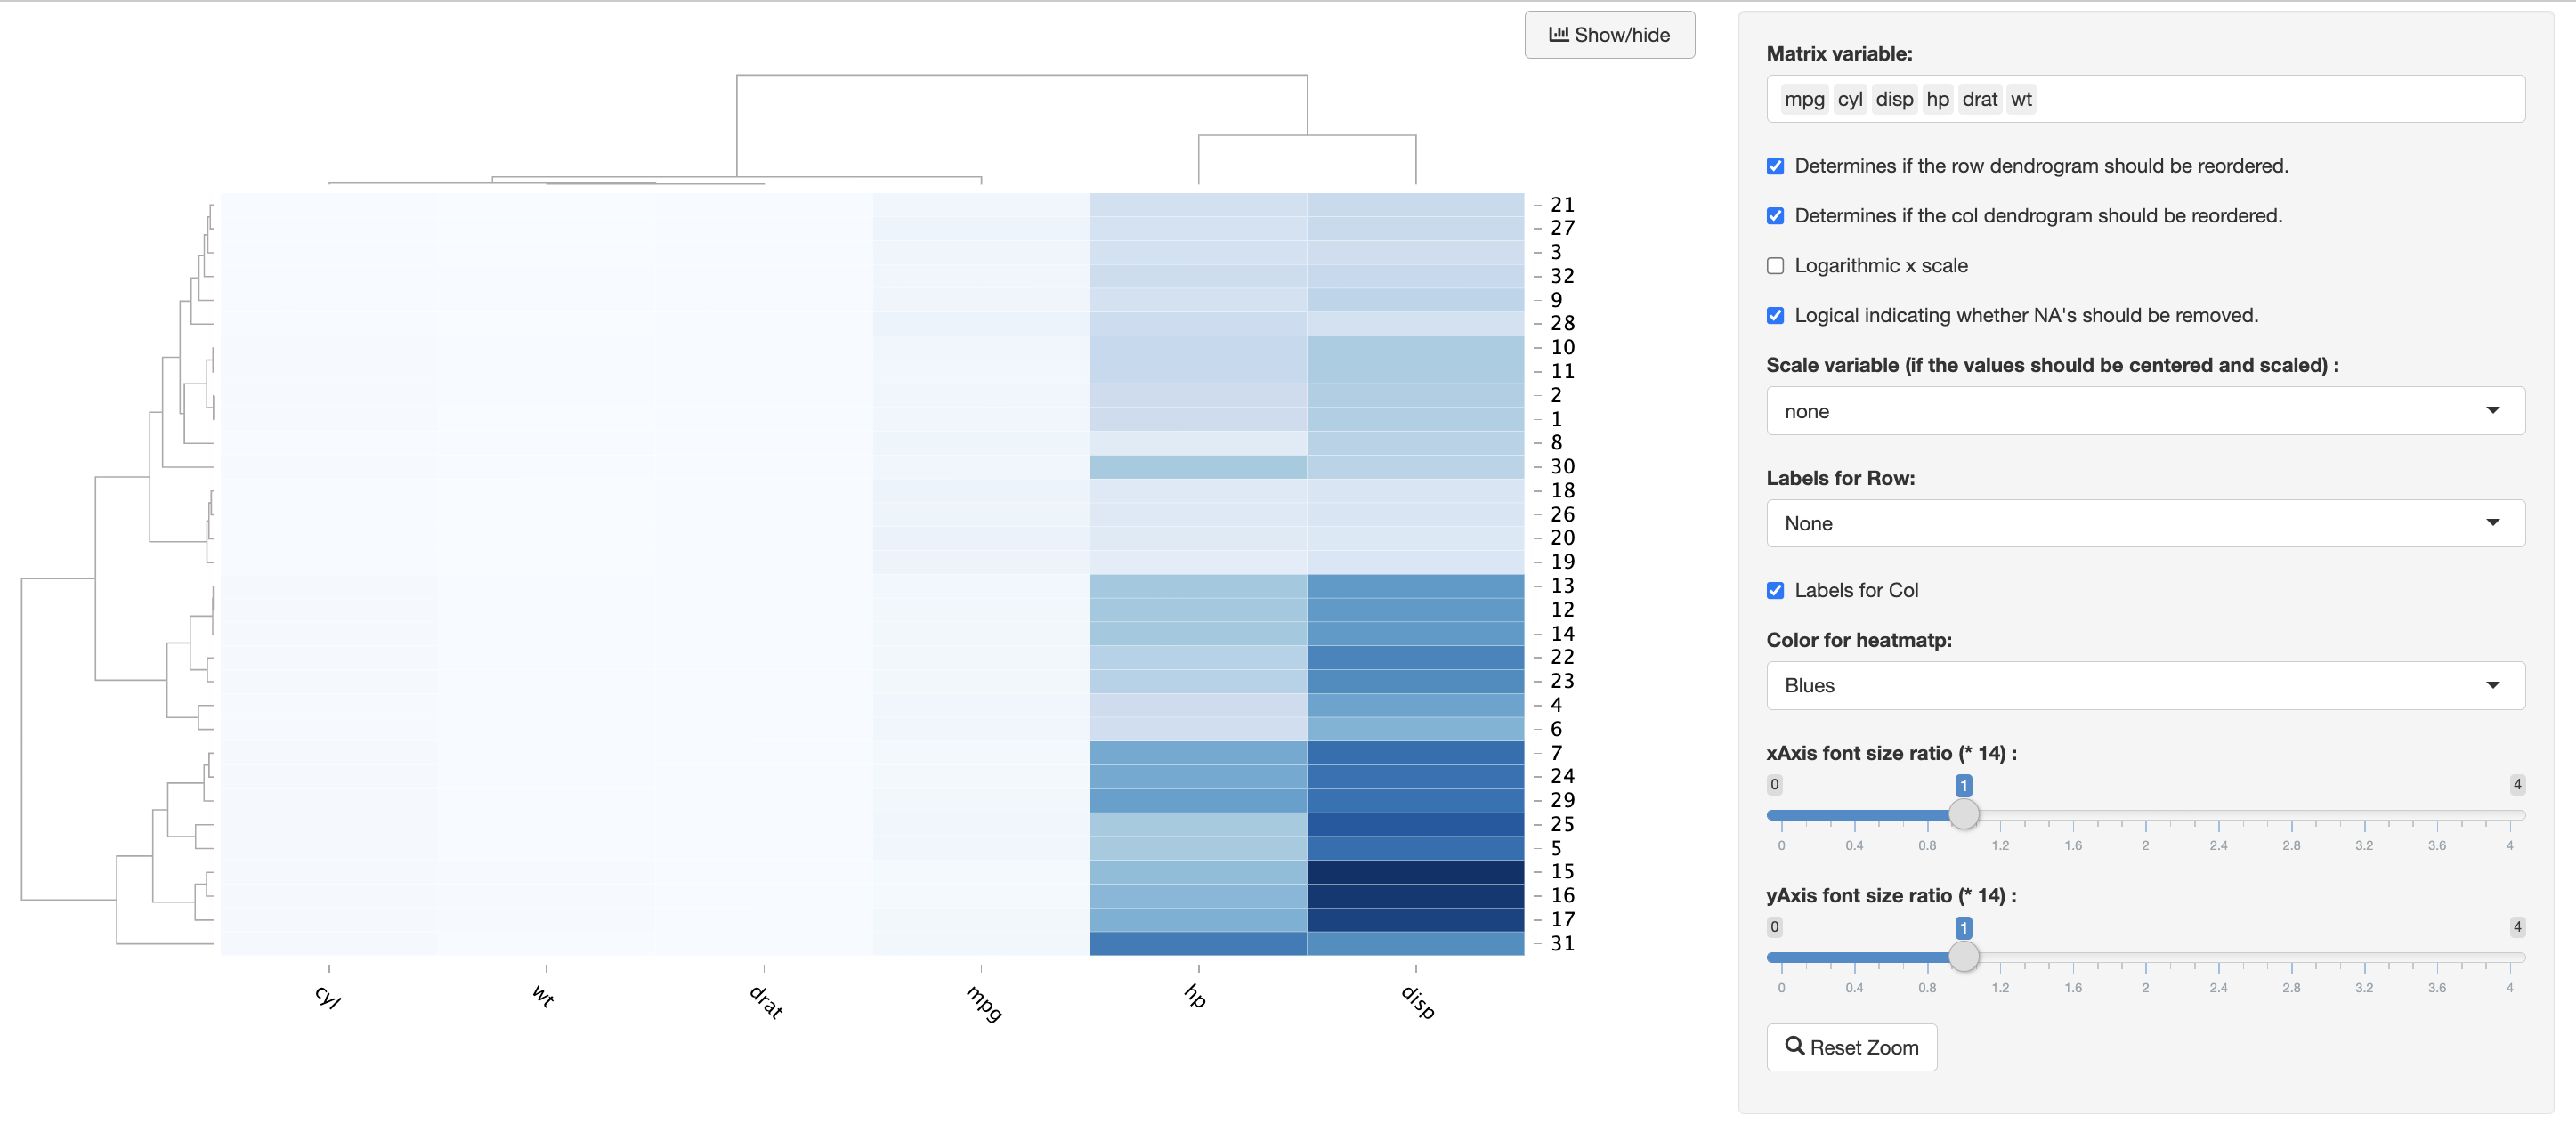
heatmap-d3-r
Interactive heatmap from a Shiny app
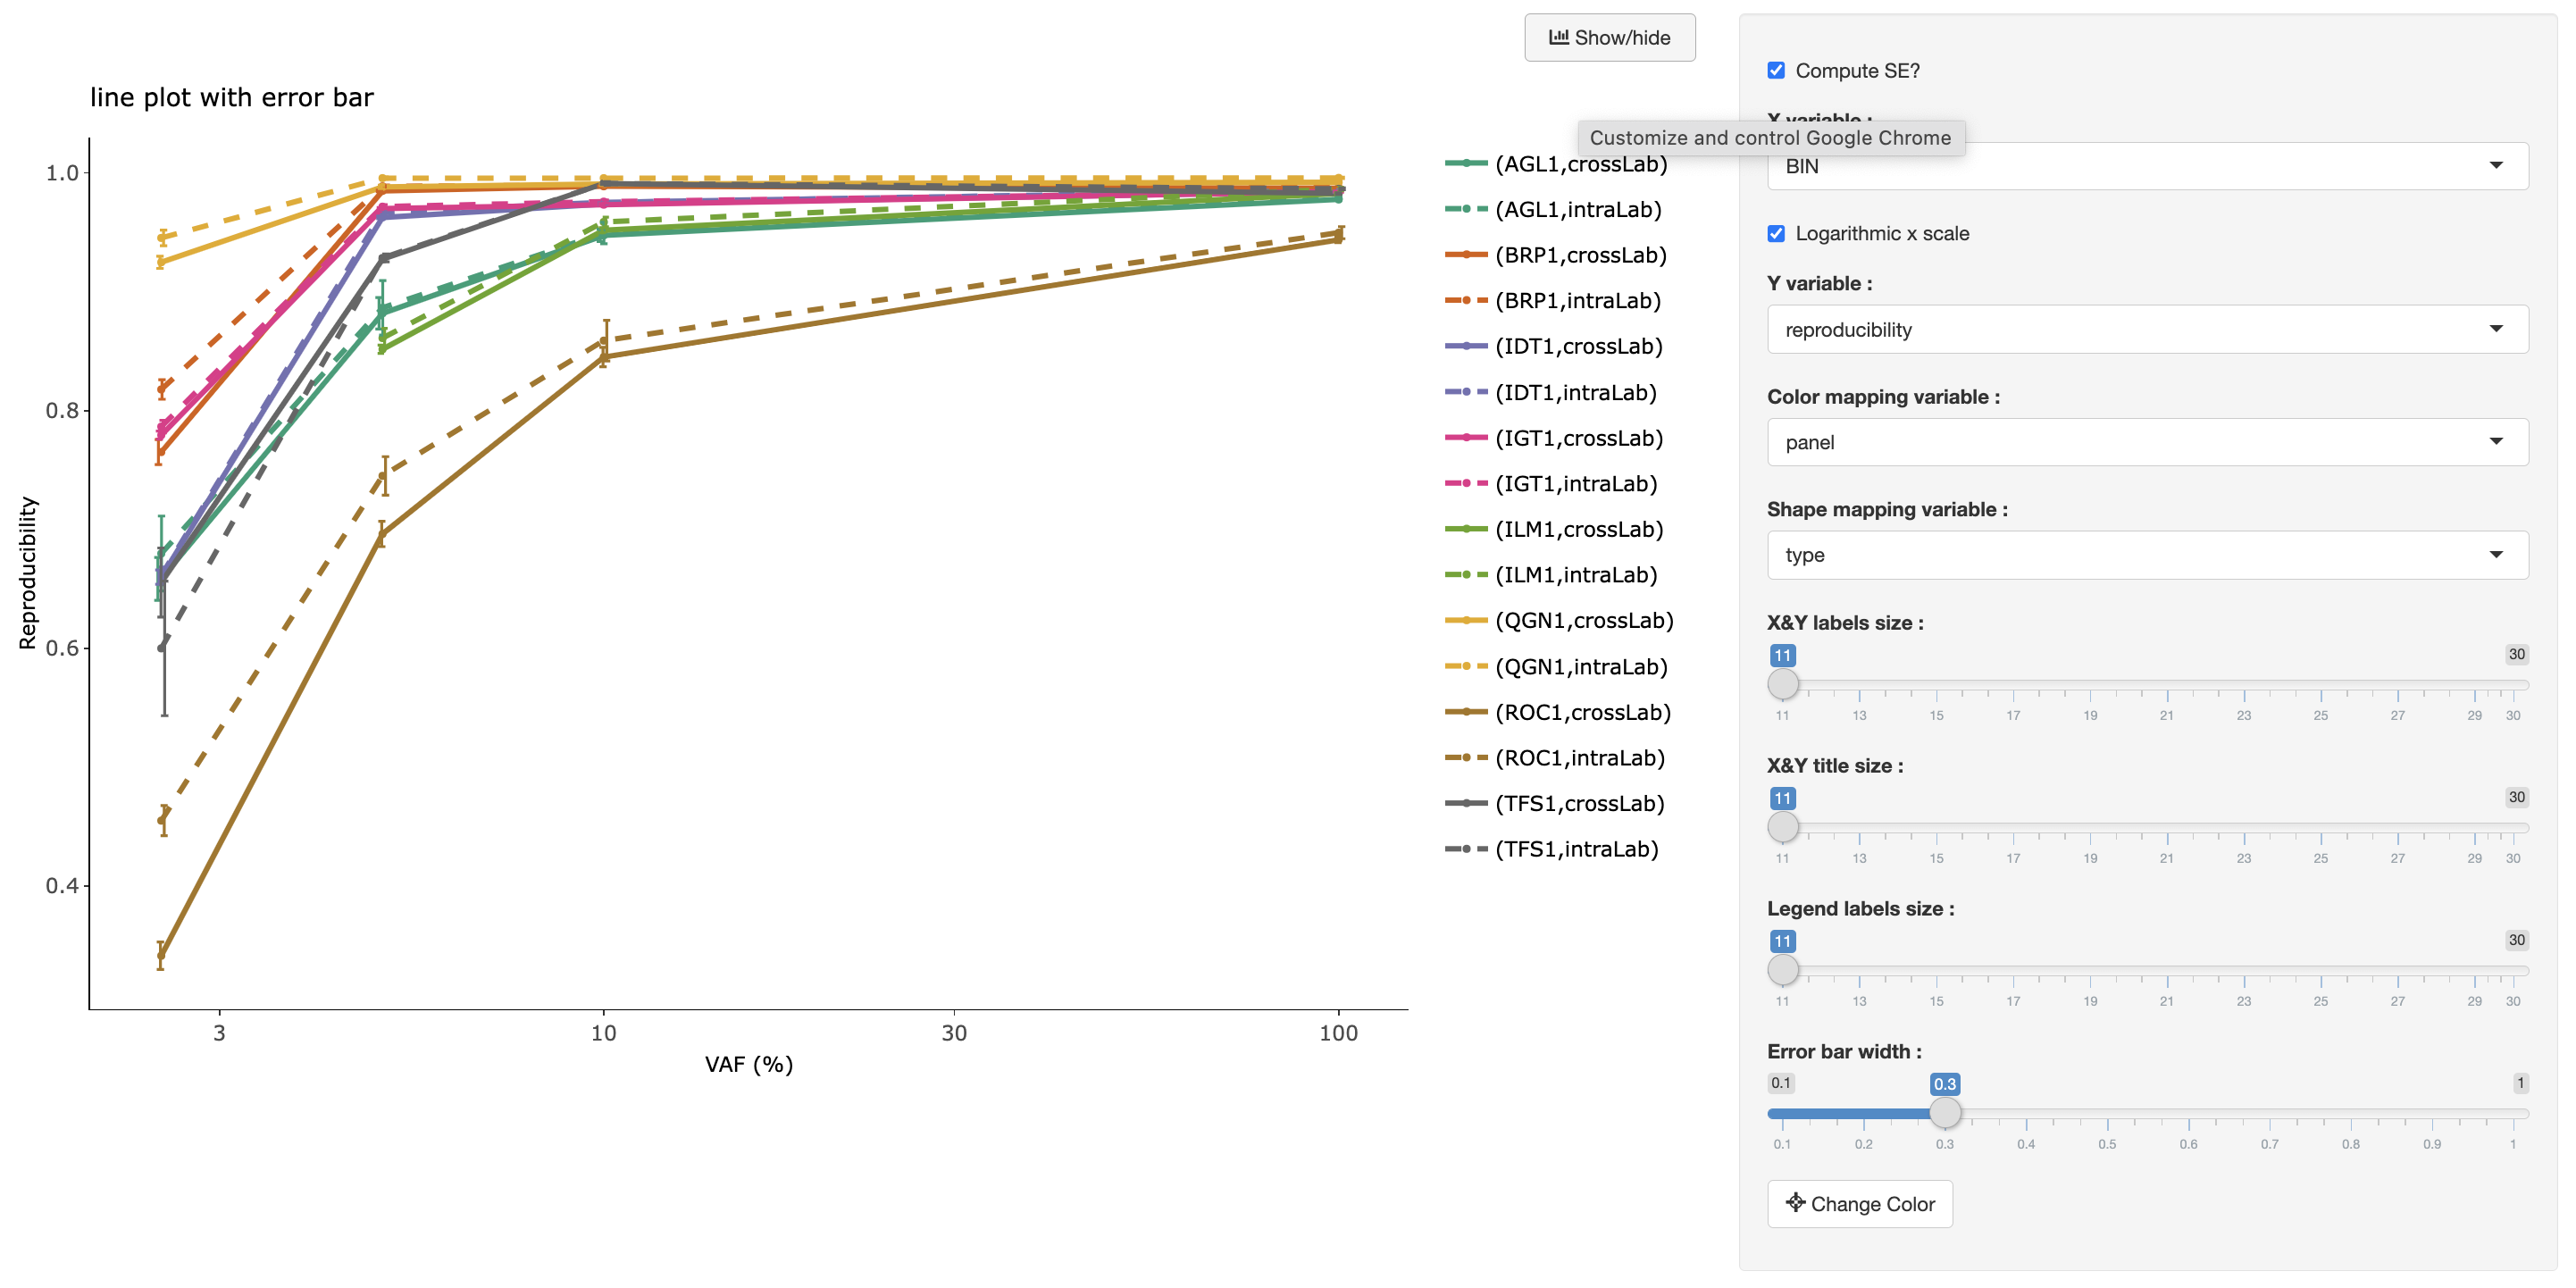
lineplot-r
Interactive line plot visualization from a Shiny app
rocket-plot-r
Interactive rocket plot visualization from a Shiny app
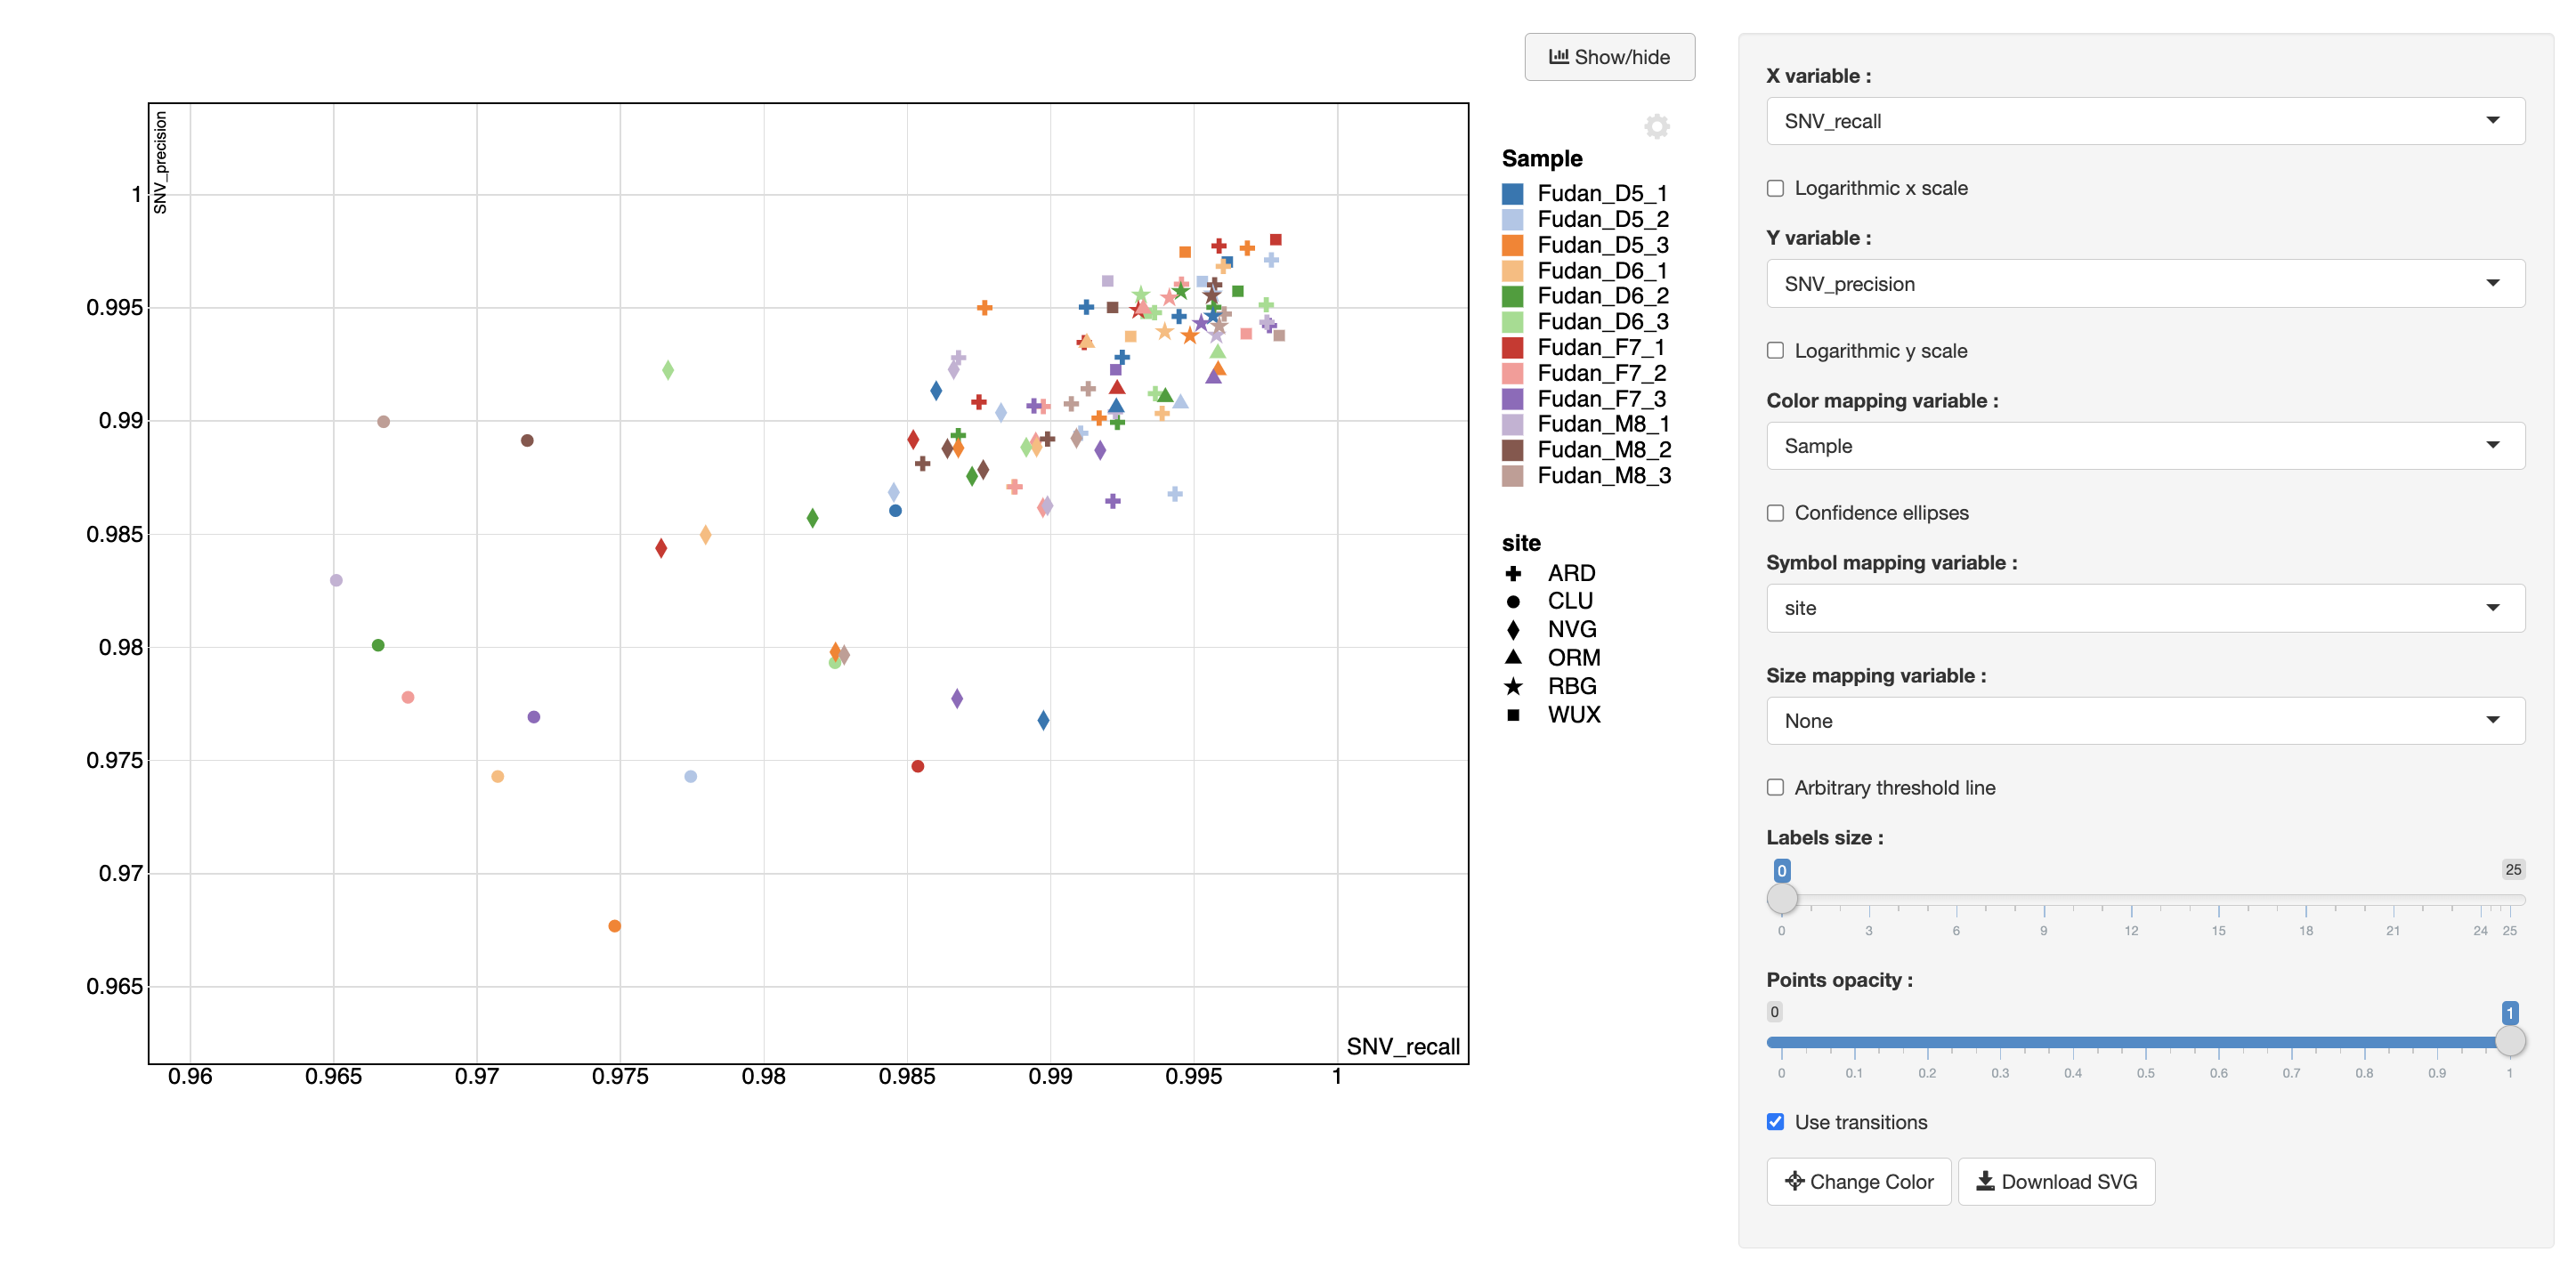
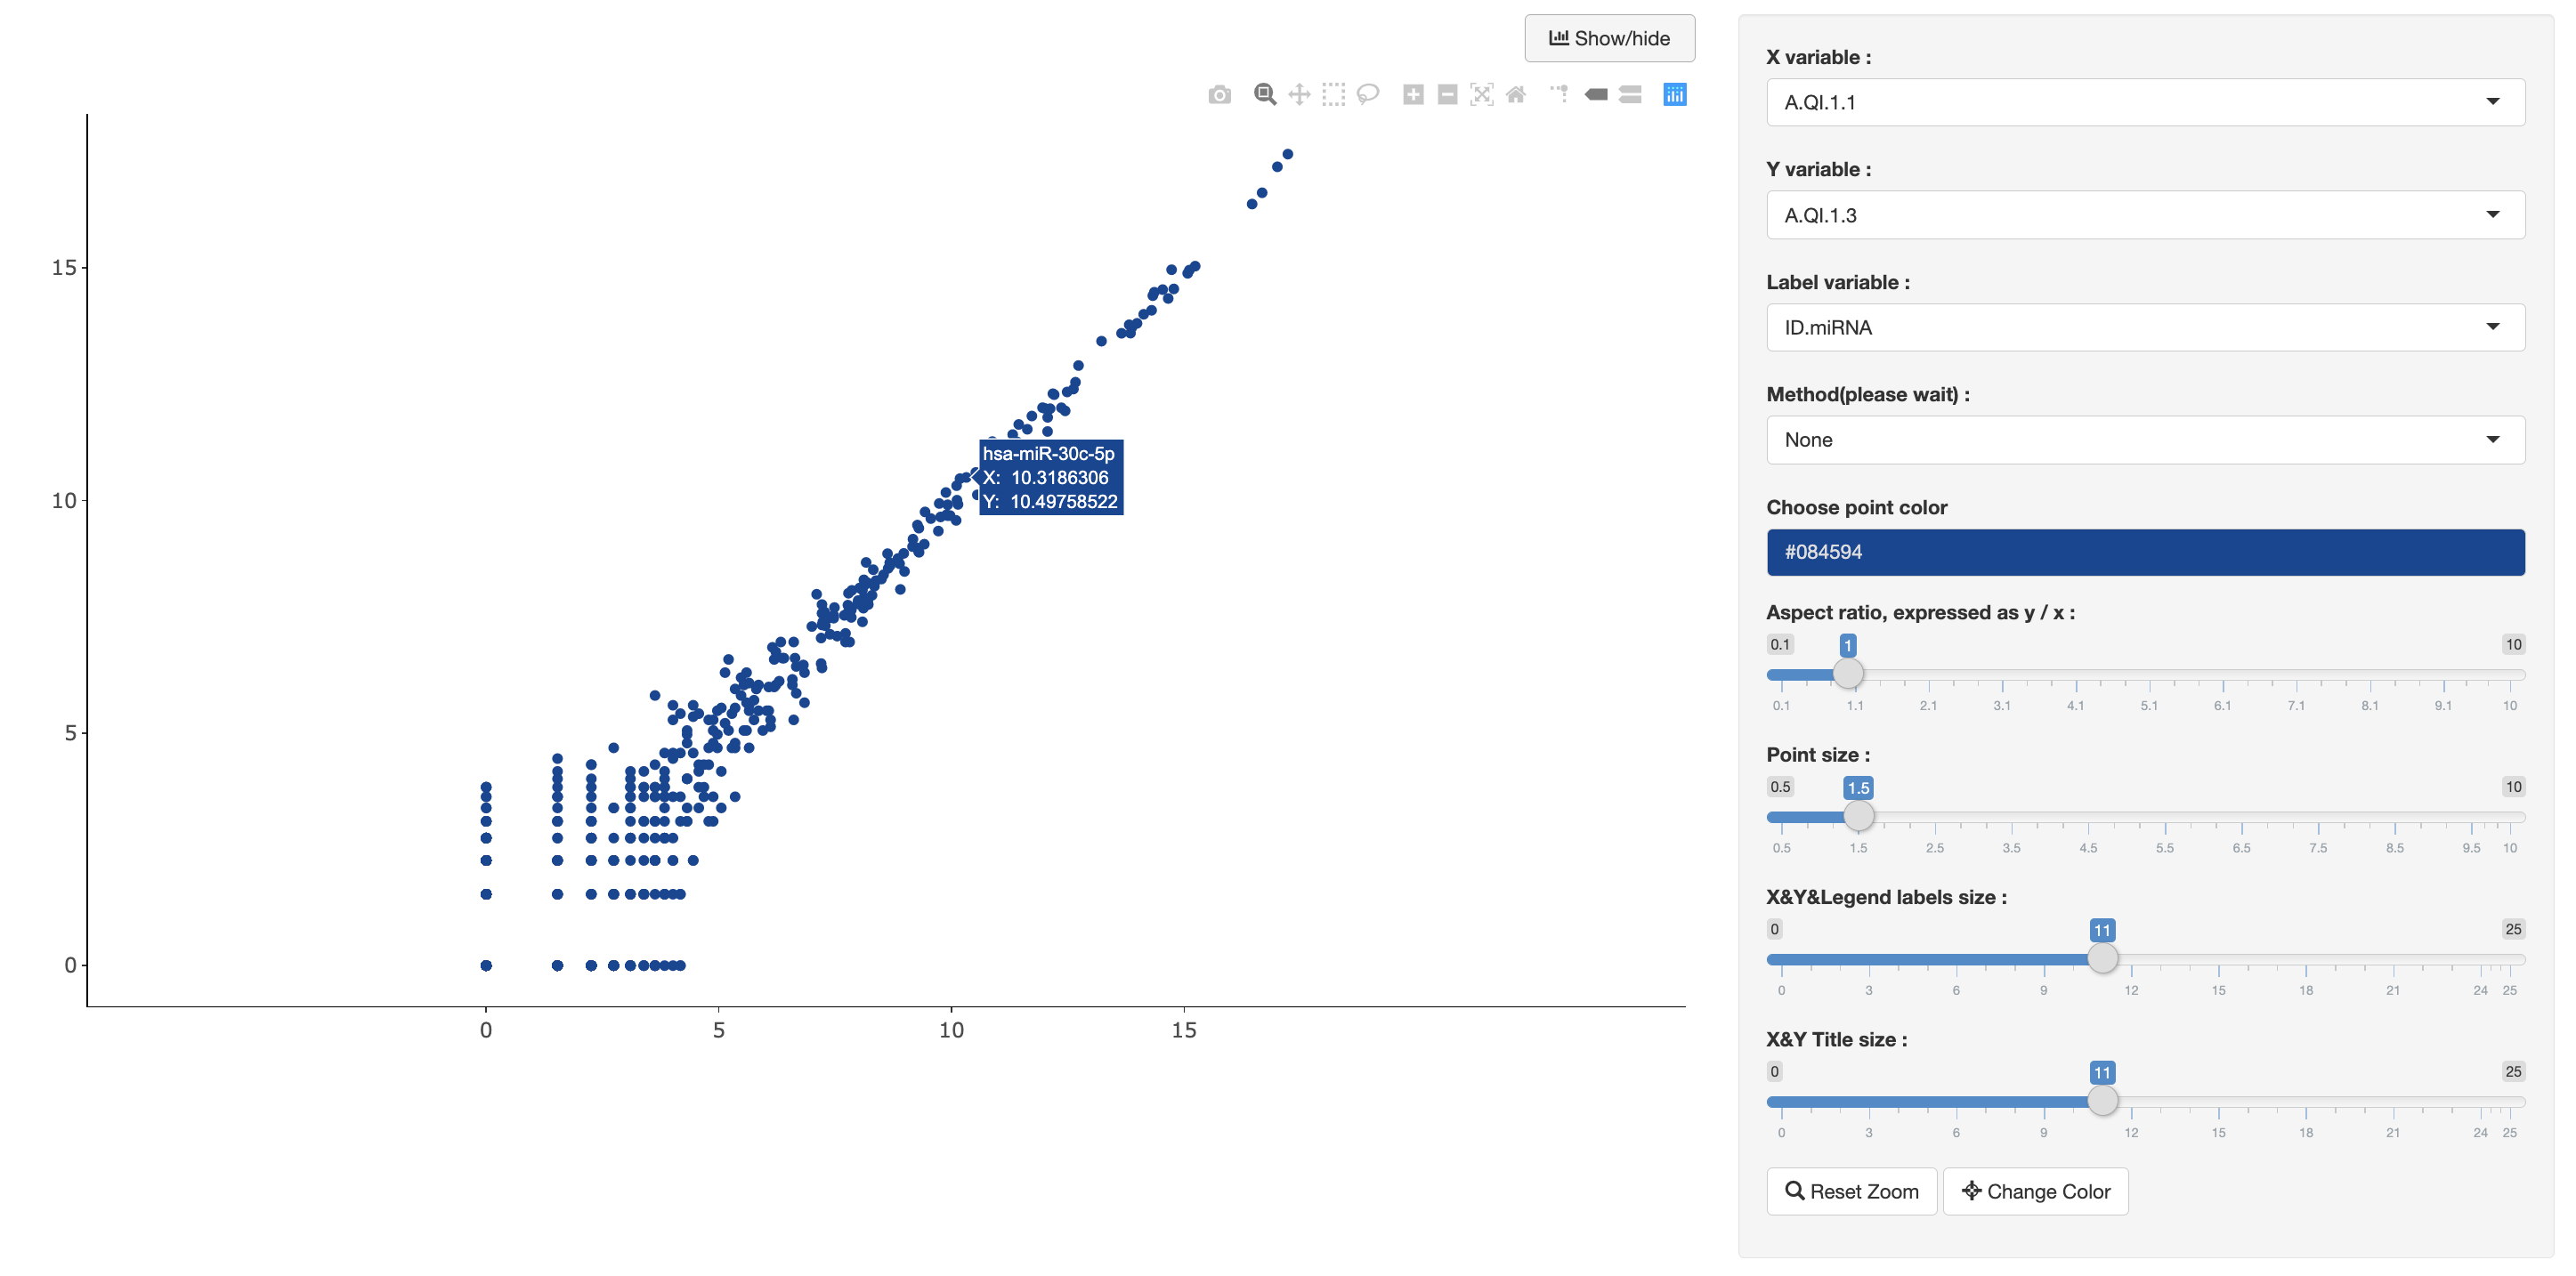
scatter-plot-r
Interactive scatter plot visualization from a Shiny app
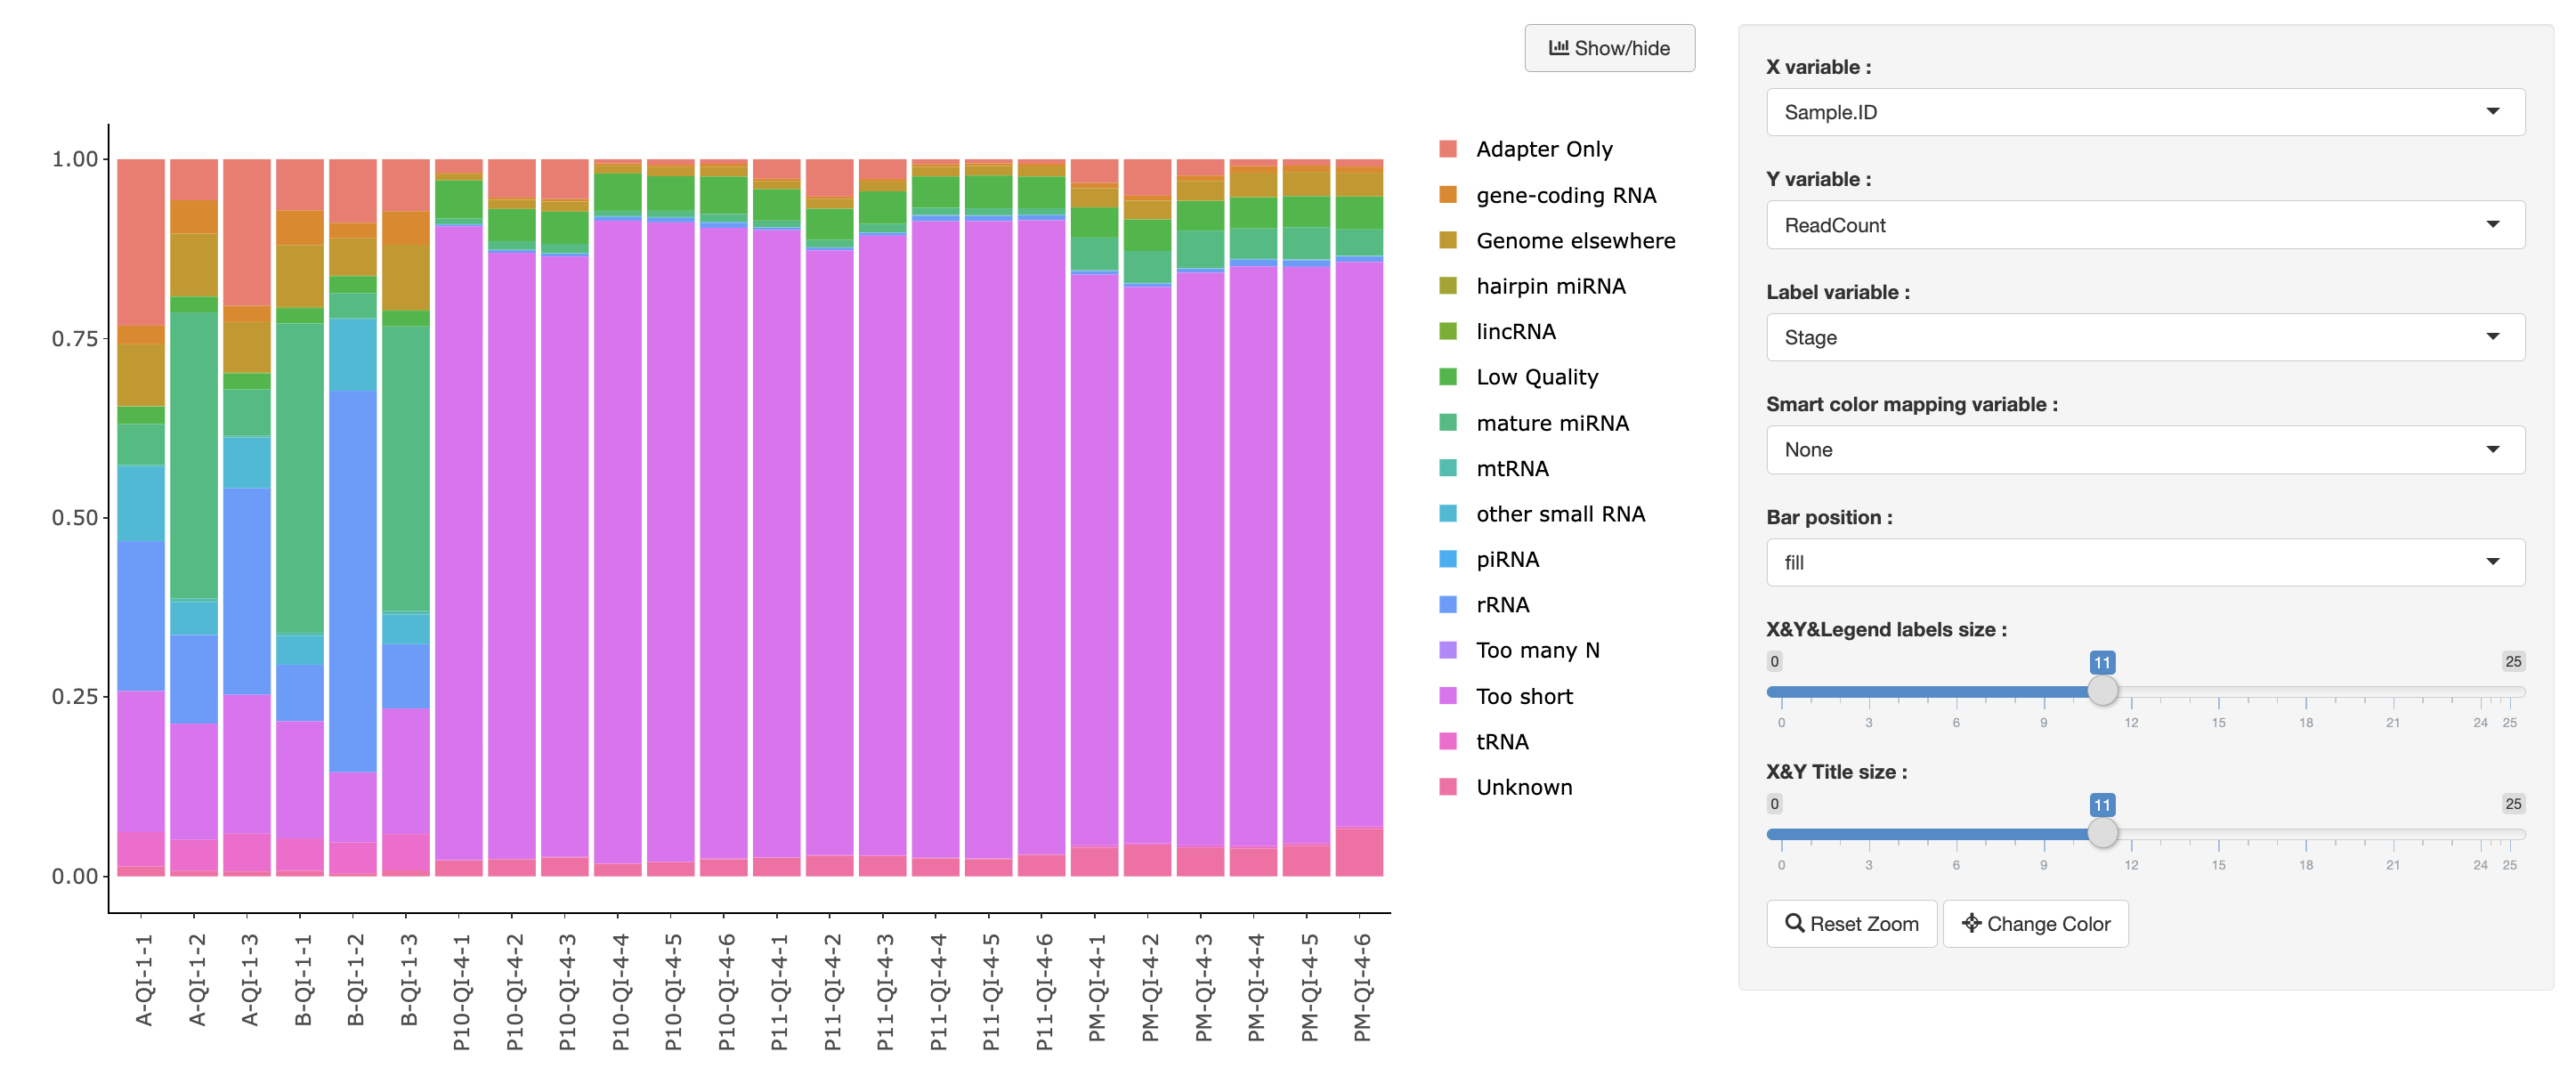
stack-barplot-r
Interactive stack barplot visualization from a Shiny app
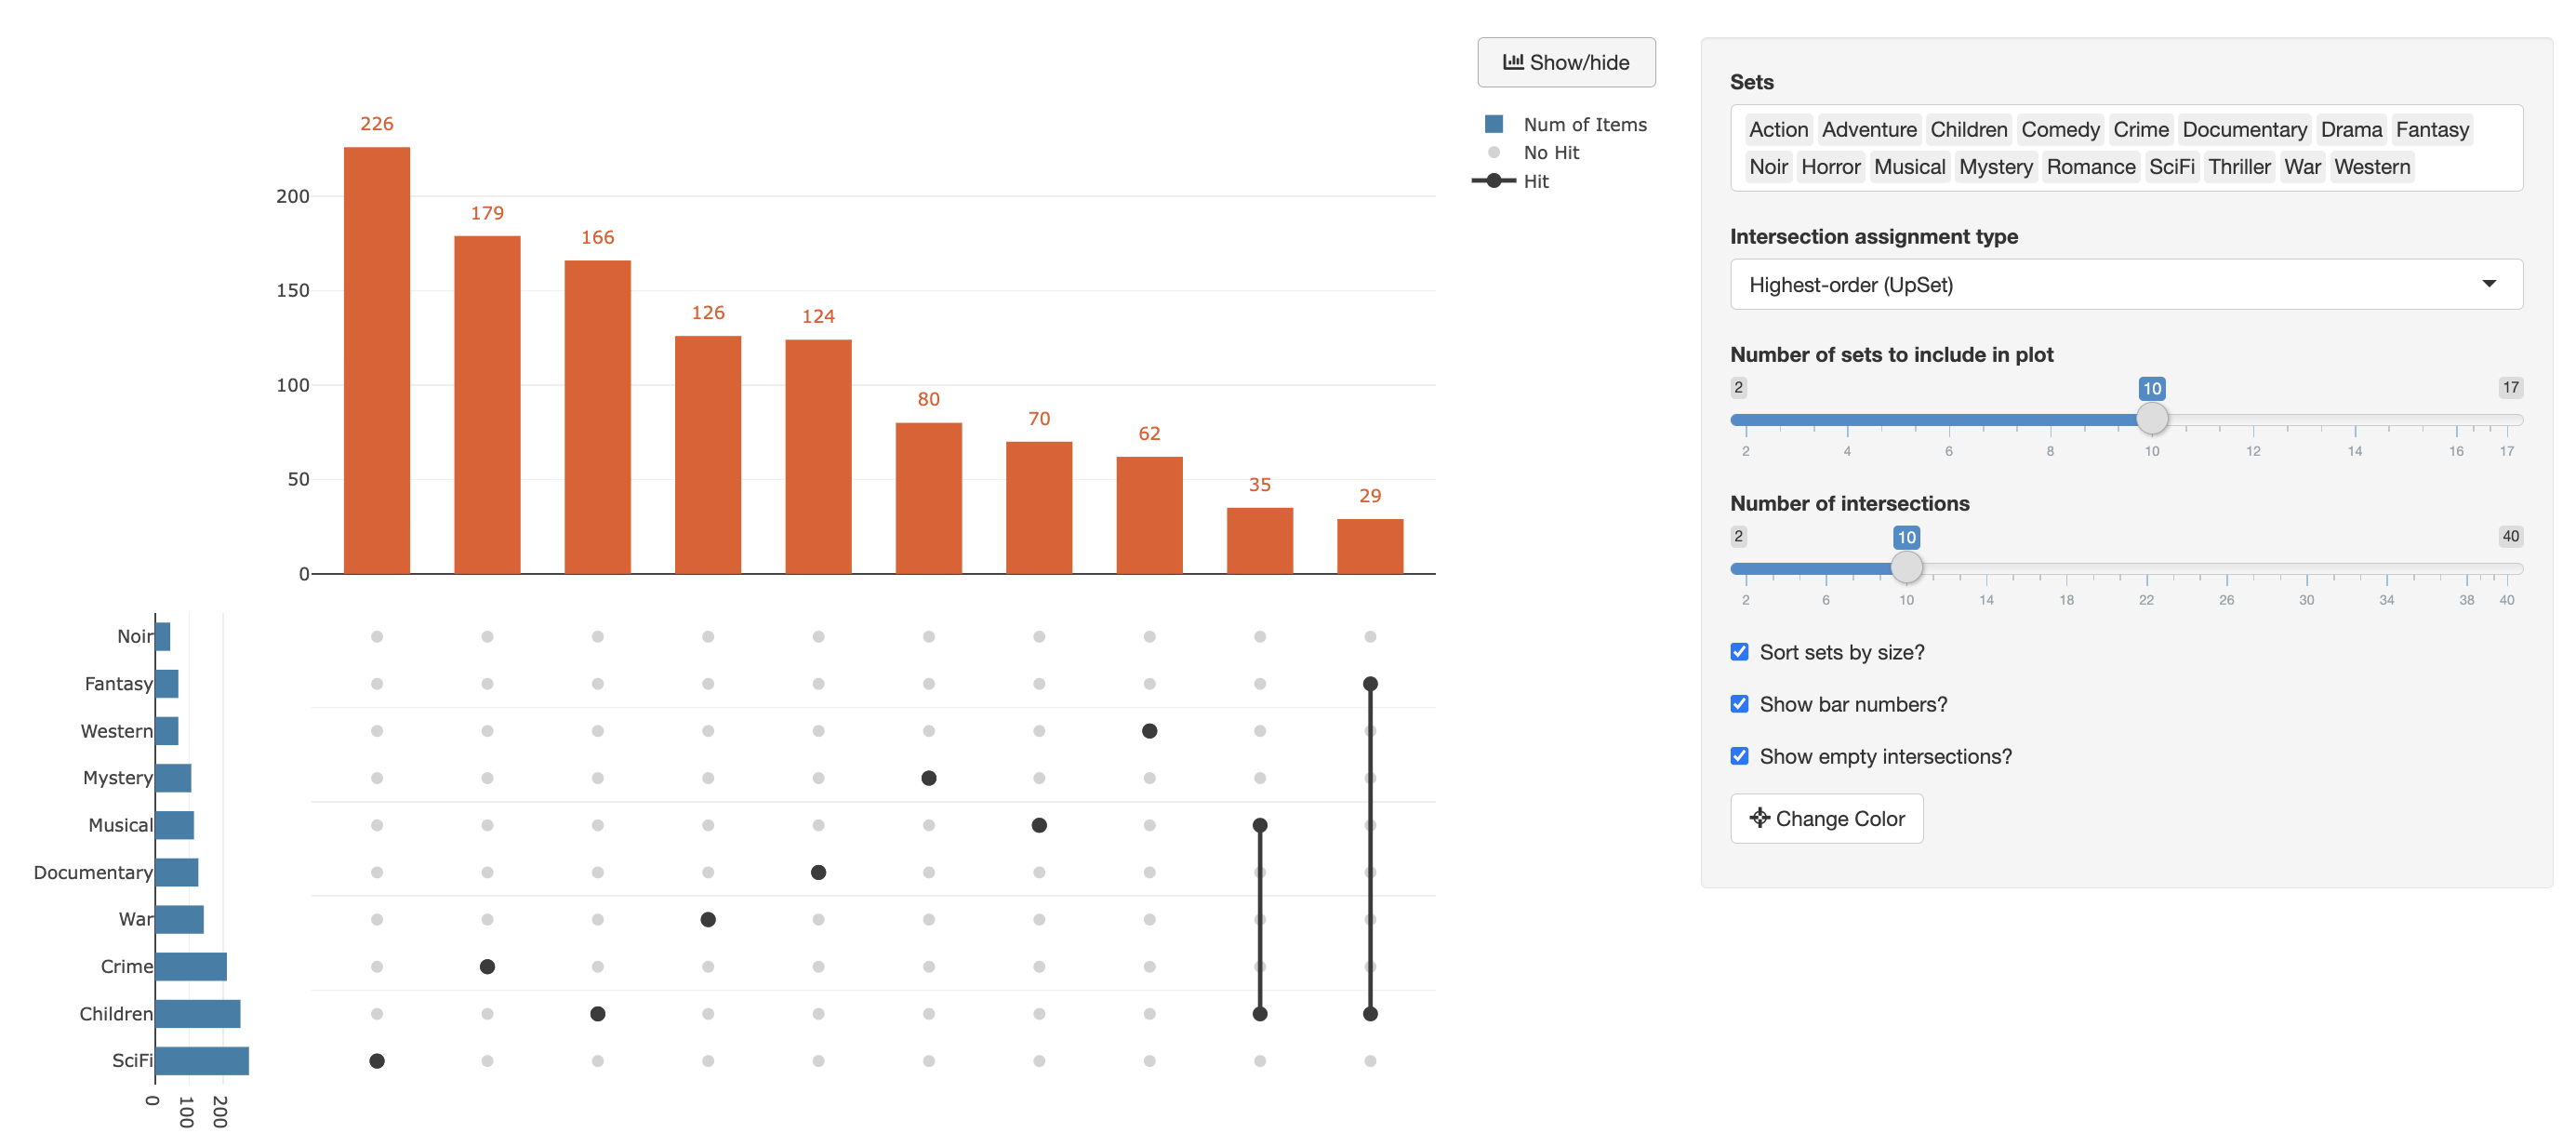
upset-r
Interactive upset plot visualization from a Shiny app

violin-plot-r
Interactive violin plot visualization from a Shiny app
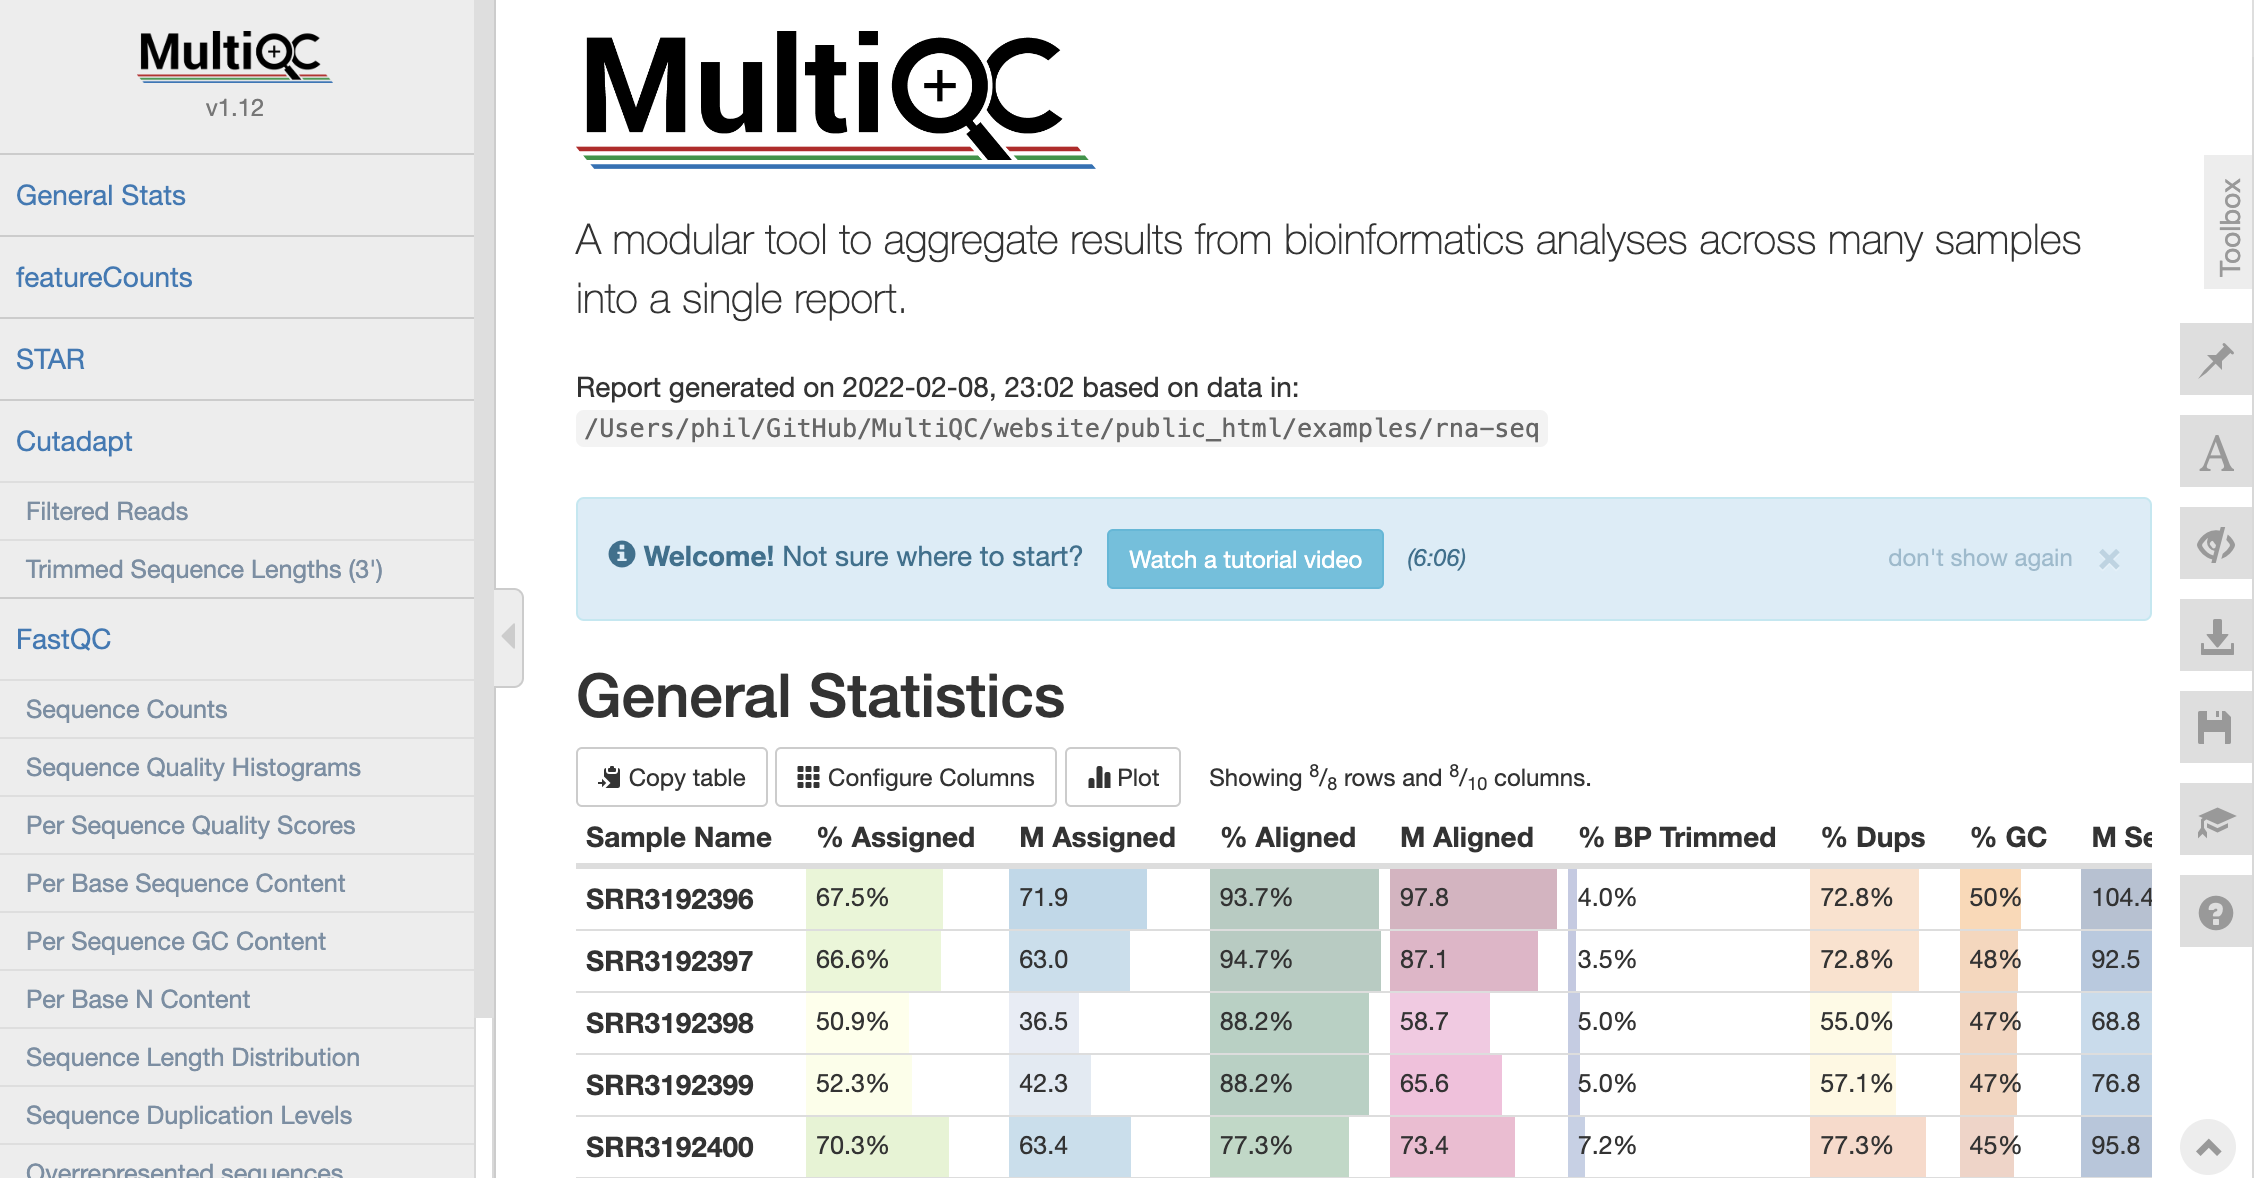
multiqc-py
MultiQC
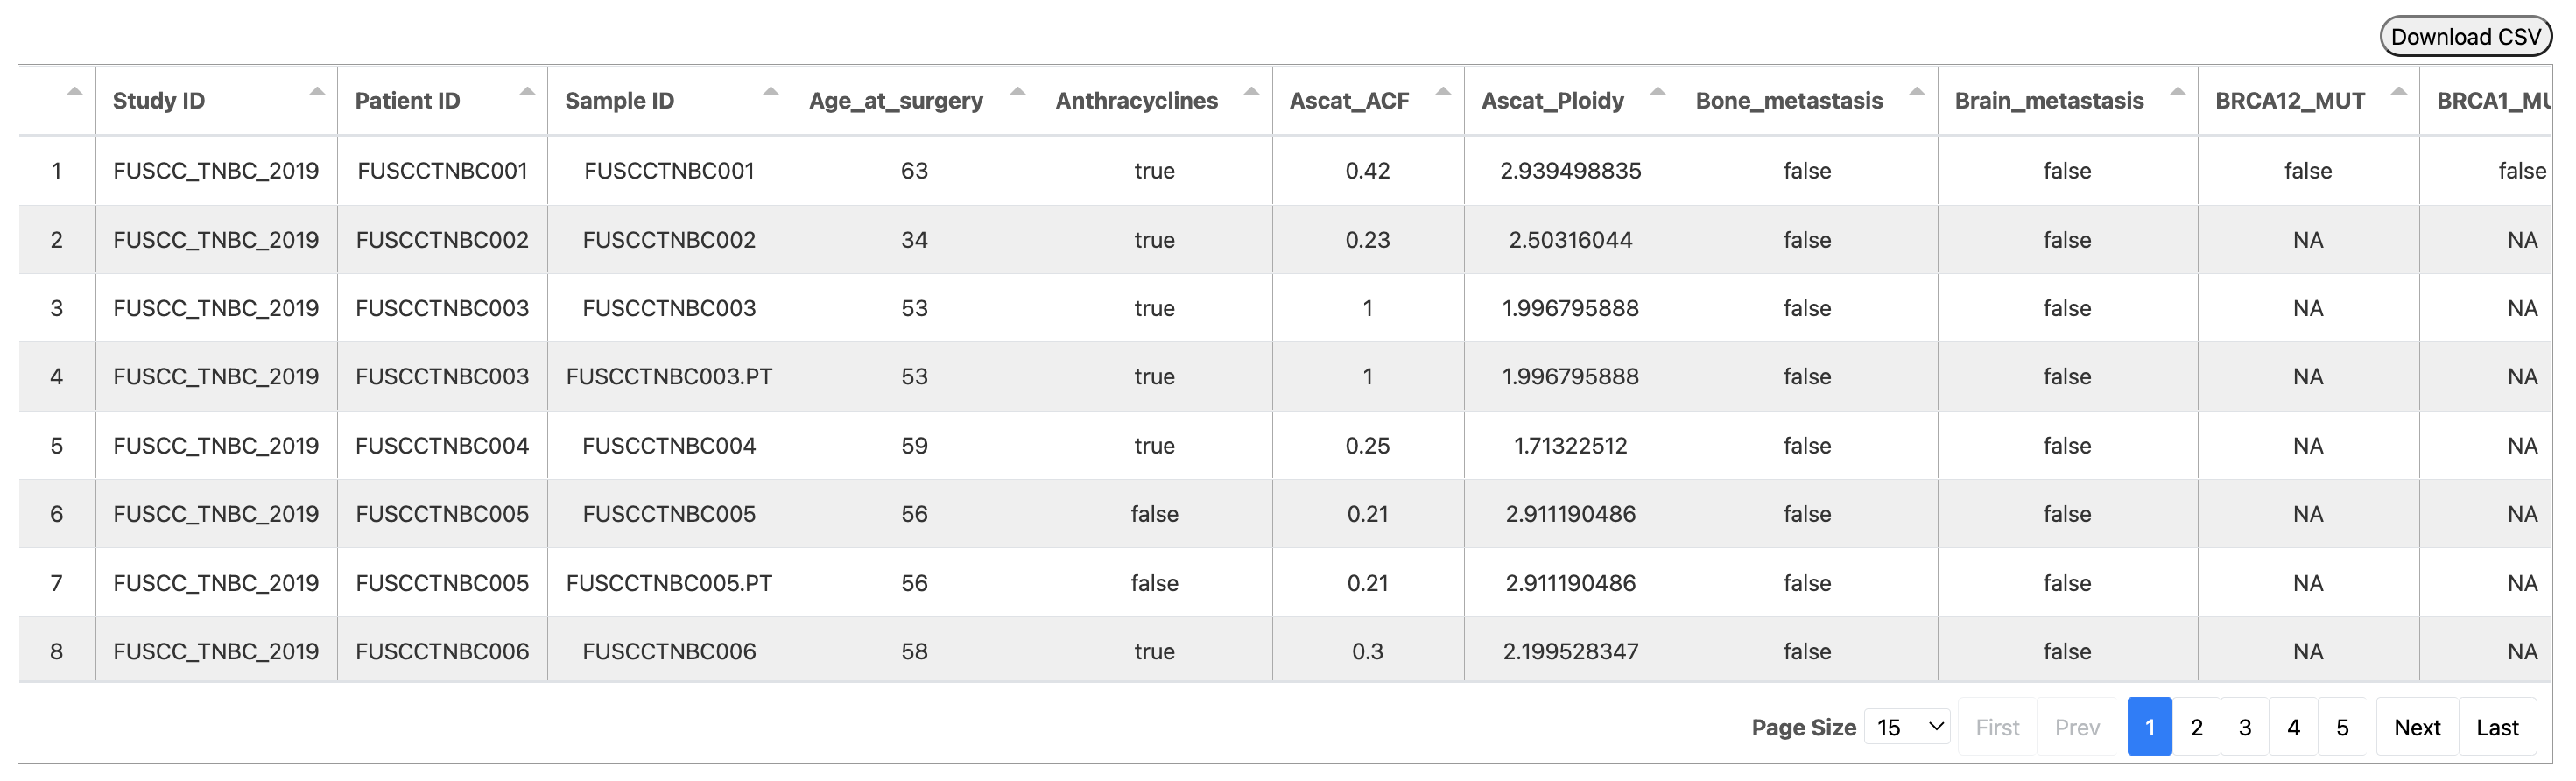
datatable-js
Interactive data table based on the JavaScript library DataTables
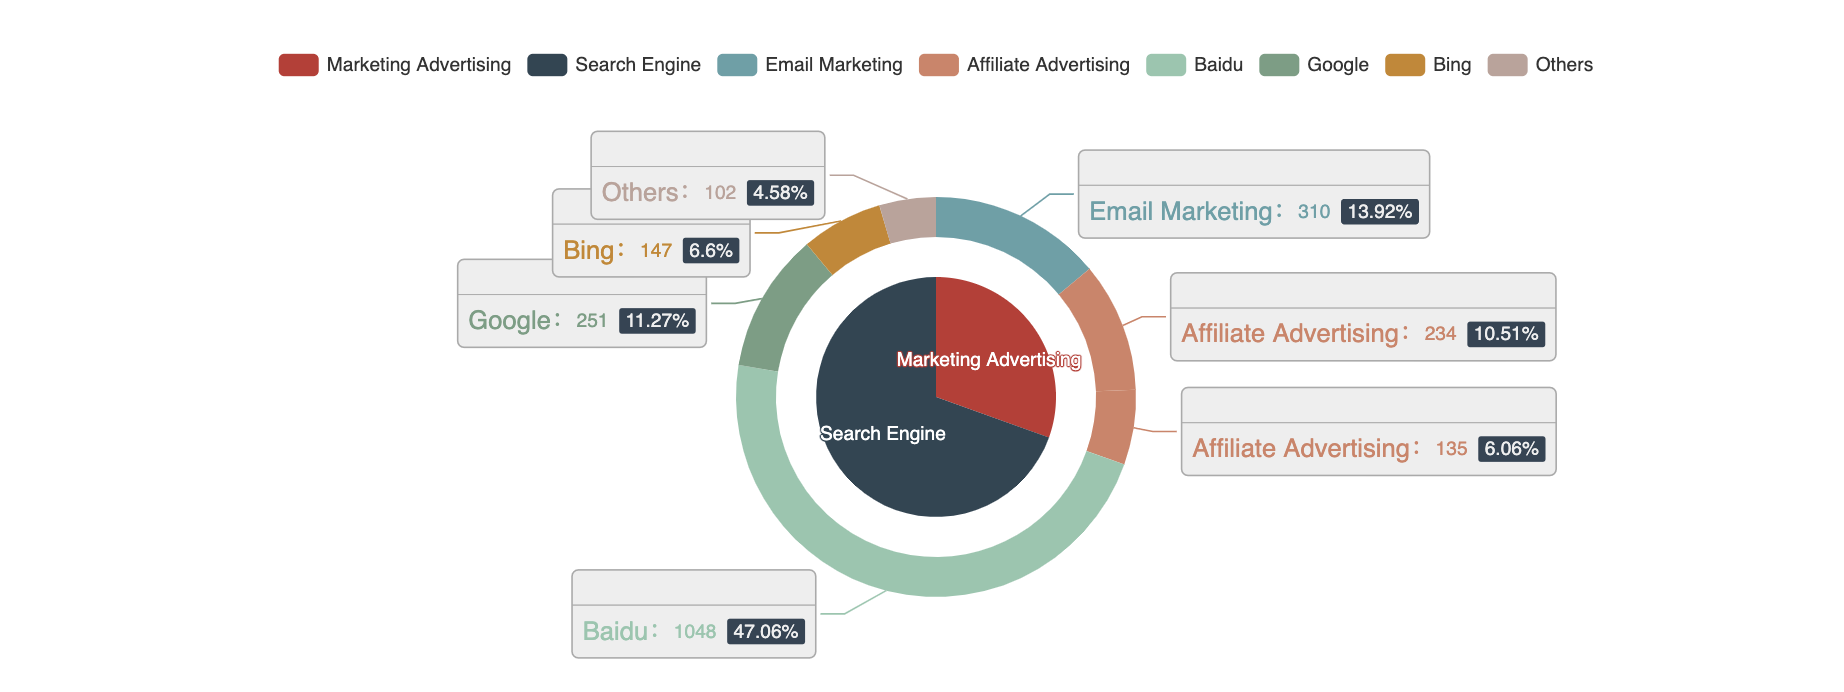
pie-chart-js
Interactive pie chart based on echarts
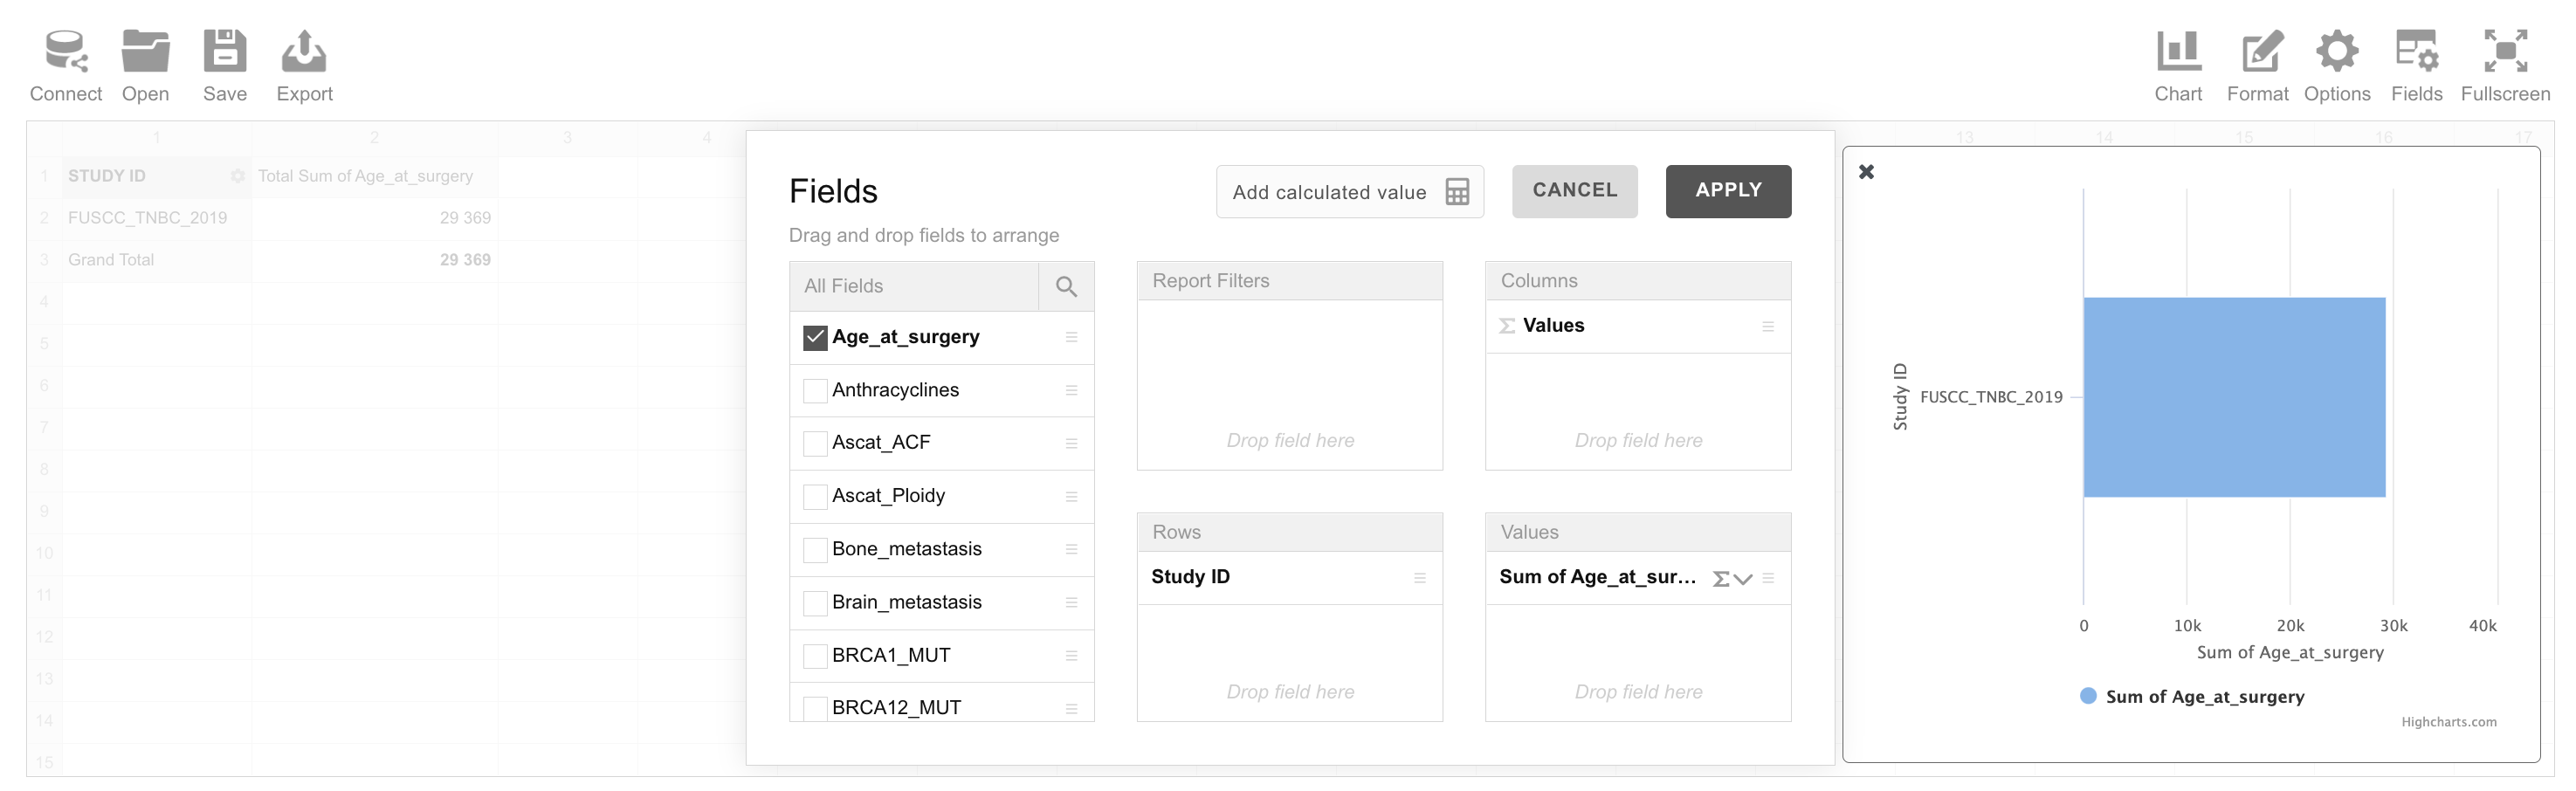
pivot-table-js
Interactive pivot-table and chart based on the WebDataRocks and Highcharts
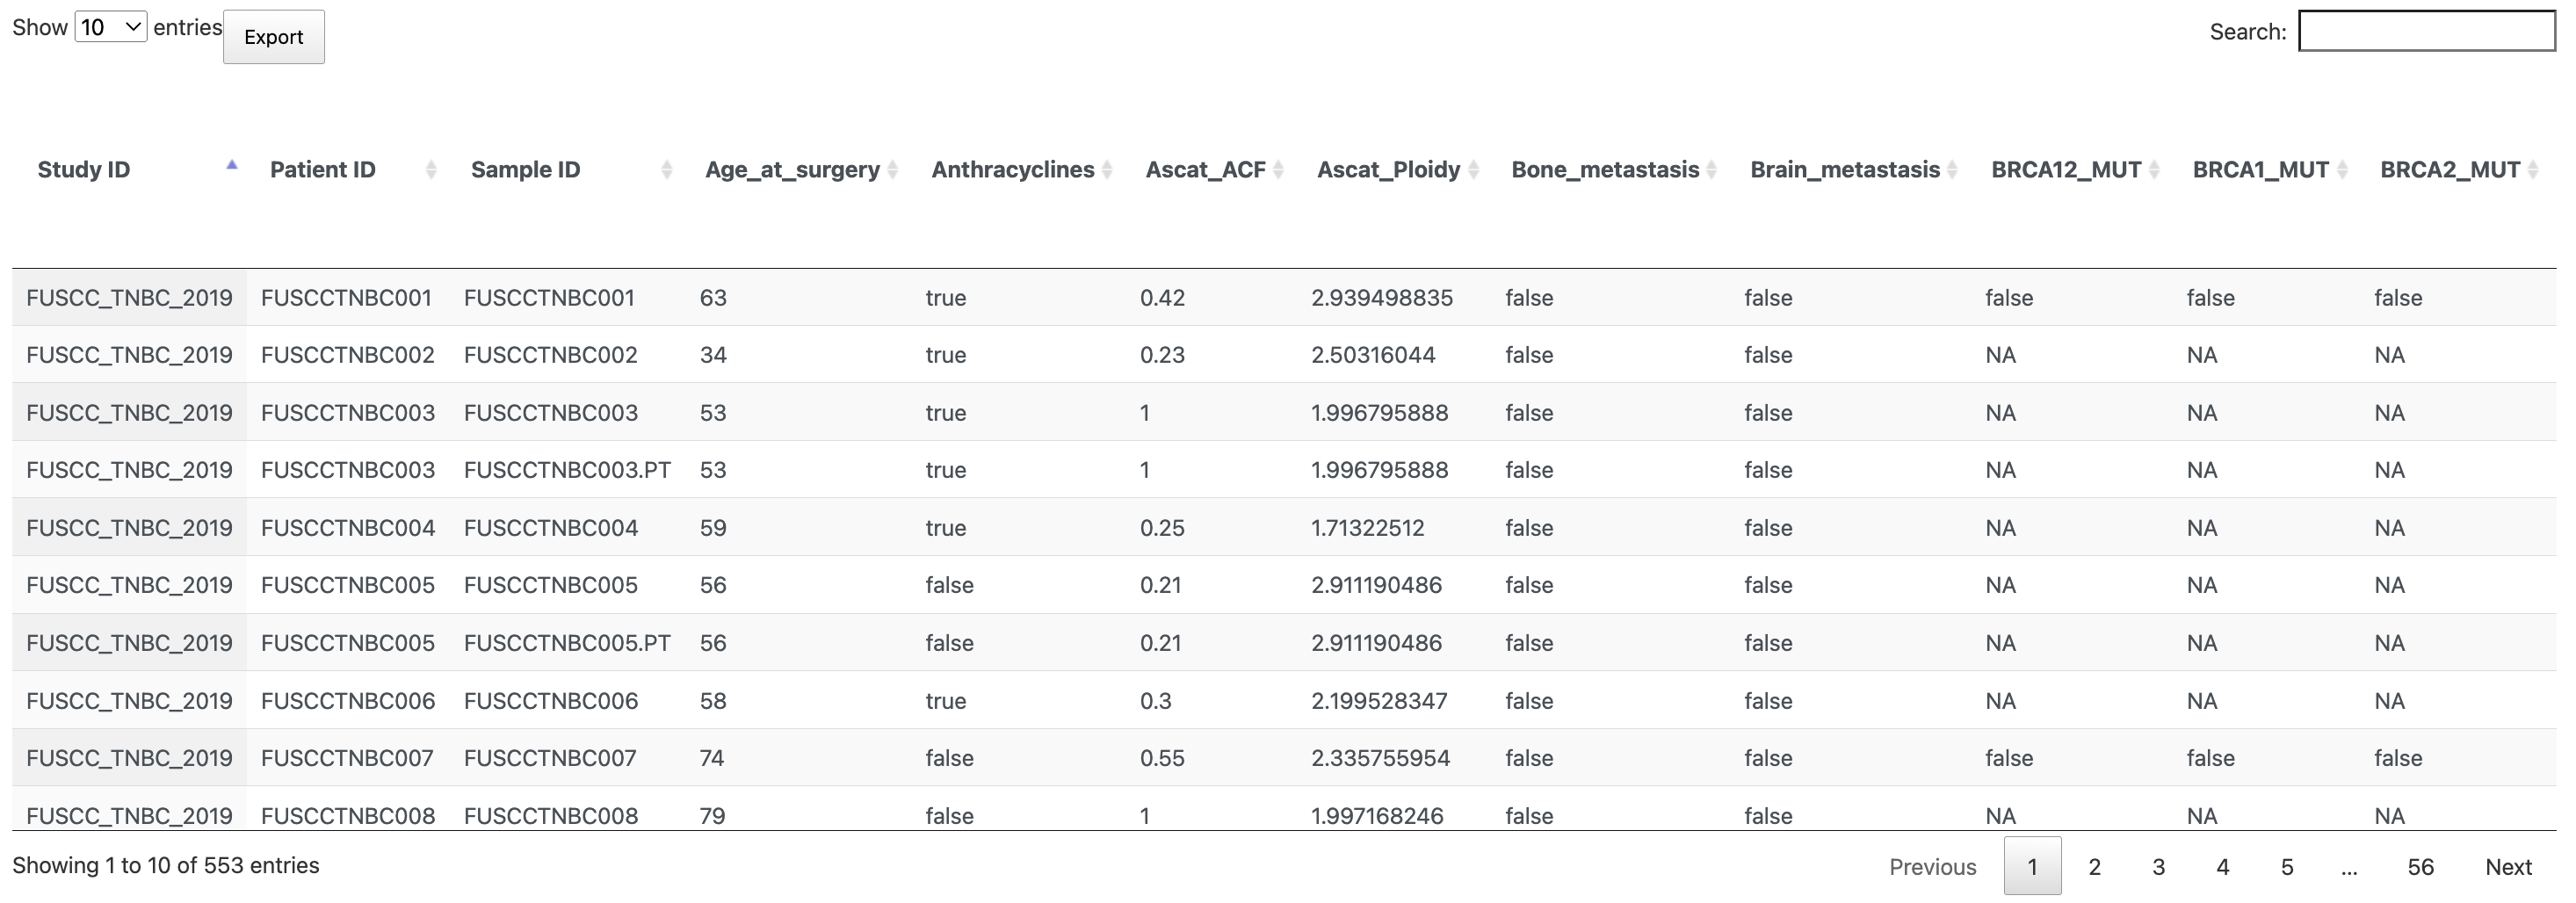
tabulator-js
Interactive table
More...
Please submit your customized plugins...
Last update:
2022-06-04